
Inheriting an instance is a normal part of the job. Somebody left, a company was acquired, a contract started, or a server nobody has looked at since it was built has suddenly become your problem. The temptation is to open the thing that was reported and start fixing. The better move is to find out what you are holding first, because almost every recommendation you might make depends on facts you do not have yet.
Step 1: What Is It
Version, edition, patch level and uptime, in that order. Edition first because it decides what is available: several features people assume are present are Enterprise only, and several that used to be were opened up to Standard in 2016 SP1, so guessing from memory is unreliable in both directions.
SELECT SERVERPROPERTY('ProductVersion') AS version,
       SERVERPROPERTY('ProductUpdateLevel') AS cu_level,
       SERVERPROPERTY('Edition') AS edition,
       SERVERPROPERTY('IsClustered') AS is_clustered,
       SERVERPROPERTY('IsHadrEnabled') AS is_hadr,
       si.sqlserver_start_time AS last_started,
       DATEDIFF(DAY, si.sqlserver_start_time, SYSDATETIME()) AS uptime_days
FROM   sys.dm_os_sys_info AS si;
Read the patch level from cu_level. ProductLevel only knows RTM and service packs, and current versions ship cumulative updates instead, so a SQL Server 2025 instance on CU8 still reads RTM there; ProductUpdateLevel carries the CU. SQL Server Builds and Support Lifecycle turns the version into a support date, and Get Patch Level names the release and the KB for you.
Uptime belongs in this step rather than later, because it decides whether the performance counters you are about to read mean anything. sqlserver_start_time is the anchor: much of what the DMVs report covers only activity since the last startup, so an instance up for months is showing you history rather than today. Measuring waits over an interval is how you get today back, and Get OS and Hardware Info puts version, CPU, memory and uptime in one row.
Step 2: What Is It Supposed To Do
Databases, recovery models, log state and owners. The recovery model is the one that catches people out: in FULL recovery the log keeps growing until a log backup runs, so a FULL database with no log backup job grows its log until the disk fills, and that combination is common on servers nobody owns. A database in SIMPLE that somebody assumes is point-in-time recoverable is the same problem wearing the opposite hat.
SELECT name,
       state_desc,
       recovery_model_desc,
       log_reuse_wait_desc,
       SUSER_SNAME(owner_sid) AS owner
FROM   sys.databases
ORDER  BY name;
log_reuse_wait_desc sits next to the recovery model because it shows the problem already happening: LOG_BACKUP means the log cannot be reused until a log backup runs, which What log_reuse_wait_desc Is Telling You walks through. Get Database Summary adds file sizes and backup currency per database, and Get Recovery Model Audit checks each recovery model against the backups the database actually has.
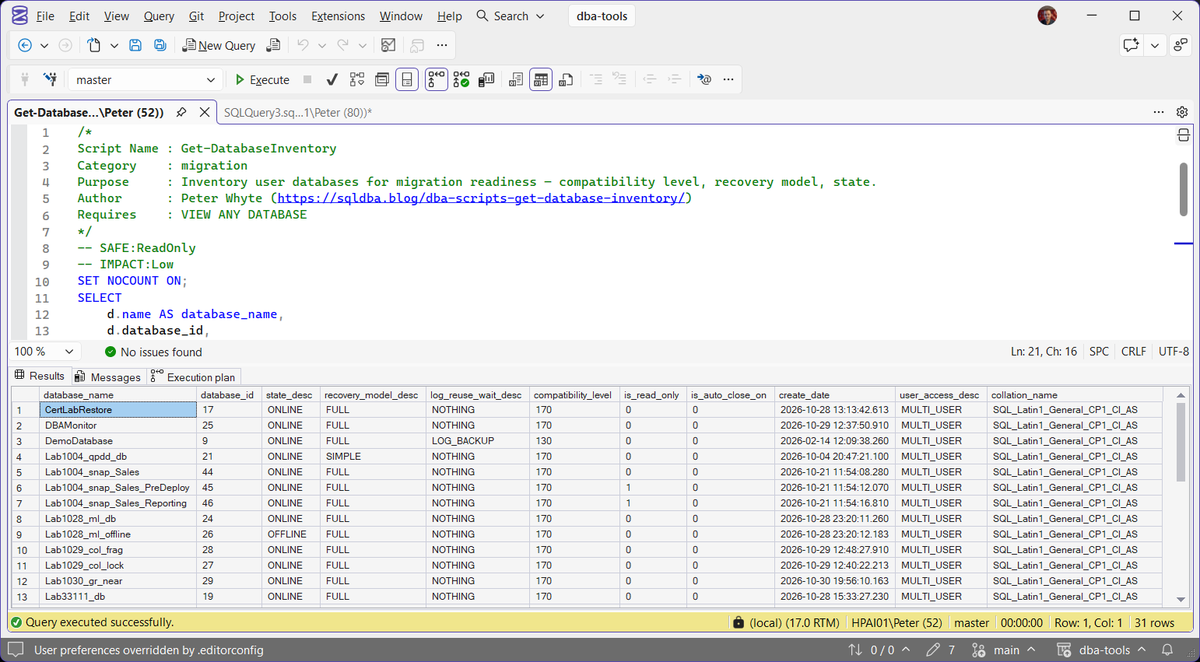
The same check from Get Database Inventory: DemoDatabase is in FULL recovery with LOG_BACKUP as its log reuse wait, the log backup gap described above.
Step 3: What Is It Short Of
Now the resource question, and only now, because you know how long the counters have been running. Memory configuration, MAXDOP, and whatever the server spends its time waiting on. Configuration that differs from the default is the interesting part: somebody changed it deliberately, usually for a reason nobody wrote down.
SELECT name, value, value_in_use, is_dynamic, is_advanced
FROM   sys.configurations
WHERE  value <> value_in_use
   OR  name IN ('max server memory (MB)', 'max degree of parallelism',
                'cost threshold for parallelism')
ORDER  BY name;
Read the three named settings first, then any other row. value and value_in_use differ when a change was made but RECONFIGURE never ran or the setting waits on a restart, which is a change queued for the next reboot. Some differences are expected: min server memory configured at 0 shows 16 in use.
sys.configurations has no default column, so this query cannot list every non-default setting on its own. Get Instance Configuration Score checks the settings that matter in one pass and returns PASS, WARN or FAIL per item. SQL Server MAXDOP and Cost Threshold covers what to set, and Get Memory Configuration and Usage and Get Wait Statistics answer the memory and waiting parts.
Step 4: What Is Unprotected
The question that matters most and gets asked last, because it is the one where a wrong answer is unrecoverable rather than merely slow. Three things: when each database was last backed up, when it was last checked for corruption, and who has sysadmin.
A server can look healthy on every performance metric and still be one disk failure away from data loss. Backup age and CHECKDB age are the two numbers that tell you whether the last month of work exists anywhere else.
SELECT d.name,
       d.recovery_model_desc,
       MAX(CASE WHEN b.type = 'D' THEN b.backup_finish_date END) AS last_full,
       MAX(CASE WHEN b.type = 'L' THEN b.backup_finish_date END) AS last_log,
       DATABASEPROPERTYEX(d.name, 'LastGoodCheckDbTime') AS last_good_checkdb
FROM   sys.databases AS d
LEFT   JOIN msdb.dbo.backupset AS b
       ON b.database_name = d.name
WHERE  d.name <> 'tempdb'
GROUP  BY d.name, d.recovery_model_desc
ORDER  BY last_full;
A NULL last_full is a database with no backup history on this instance, and a last_good_checkdb of 1900-01-01 means no successful CHECKDB on record. Backup history is local to the instance, so confirm before raising it: backups taken on another availability group replica, or by a snapshot tool that bypasses SQL Server, leave no row in msdb.
Get Last Database Backup Times and Get Last DBCC CHECKDB are the fuller versions of those columns. Get Sysadmin Members answers the third question; a Windows group in that list gives sysadmin to every one of its members.
What Not To Do In The First Hour
- Do not change anything. You do not yet know why it is set that way, and an unfamiliar server is the worst place to discover that a setting was load-bearing.
- Do not run a repair. If you find corruption, the first move is to protect the backups you already have, not to reach for
REPAIR_ALLOW_DATA_LOSS. DBCC CHECKDB Found Corruption covers what to do instead. - Do not restart it to “clear things down”. You lose every counter that would have told you what was happening, and you will need those.
- Do not kill sessions because a list looks long. Long-running is not the same as stuck, and the head of a blocking chain is not always the session doing the most work. Troubleshoot SQL Server Blocking finds the real head.
The One-Command Version
Everything above is a list of questions rather than a list of scripts, on purpose: the order is the useful part and it is worth knowing whether or not you use any particular tool. If you want the same ground covered in one pass, Run a Full SQL Server Health Check collects it and hands back a findings list rather than raw output, which is a shorter route to the same answers.
Frequently Asked Questions
Why does edition come before performance?
What if the server has been up for a year?
Is there anything worth changing on day one?
How do I know which config values are non-default?
sys.configurations has no default column, and value against value_in_use only shows changes still waiting on RECONFIGURE or a restart, as in step 3. For the settings that matter, Get Instance Configuration Score checks each one and says PASS, WARN or FAIL. Treat every surprise as a question rather than a fault: somebody set it deliberately, and finding out why is part of taking the server on.Related
- SQL Server Recovery Models Explained, what each model protects and what it costs
- Get Version and Edition, the step 1 facts as a saved script
- Check When SQL Server Was Last Restarted, every way to read uptime
- Get SQL Agent Job Overview, every job, its schedule and its last outcome
- Locked Out of SQL Server, when the sysadmin answer is nobody you can reach
- Server and Configuration, the configuration scripts behind step 3
- Backups and Recovery, the backup and restore scripts behind step 4
- DBA Scripts: The Complete Guide
Leave a Reply