
The wait library on this site covers what each wait type means, and the library page covers how to read the output of sys.dm_os_wait_stats. Both assume you are looking at a number worth reading. On an instance that has been up for months, often you are not.
Every counter in that DMV accumulates from the moment SQL Server started. A server up for 300 days is showing you 300 days of accumulated waiting. An incident that lasted 40 minutes this morning contributes a rounding error to that total, and a problem that was fixed in June is still sitting near the top of the list, still collecting attention it no longer deserves.
That is not a flaw in the DMV. It is a counter, and counters count. The mistake is reading a cumulative counter as though it described the present.
Check the Uptime Before You Read Anything
The first number to look at is not a wait type. It is how long the counters have been accumulating, because that decides whether the list means anything at all:
SELECT sqlserver_start_time,
       DATEDIFF(hour, sqlserver_start_time, GETDATE()) AS hours_up
FROM   sys.dm_os_sys_info;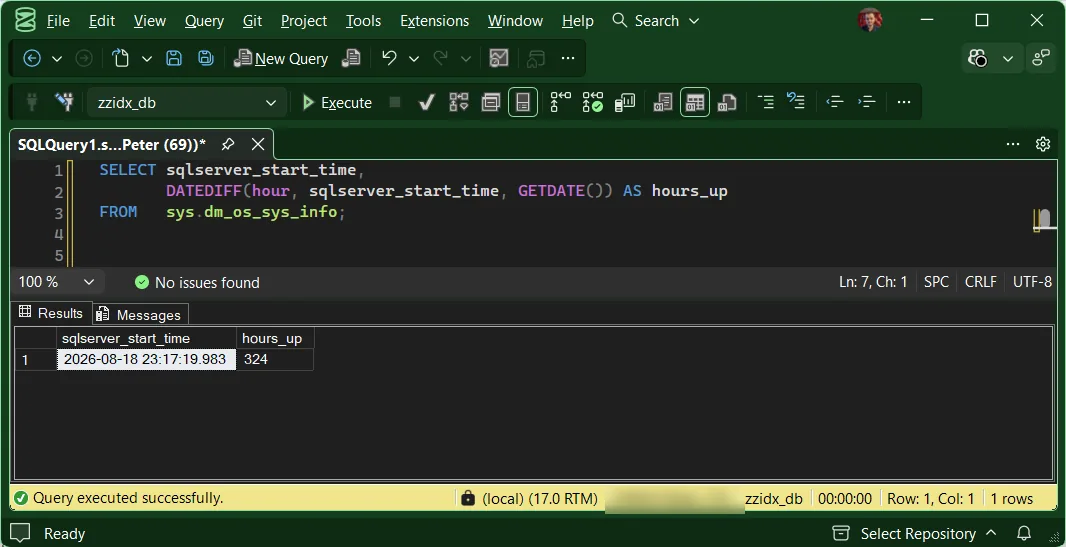
A few hours of uptime after a restart is a genuinely useful window, and the totals are close enough to “recently” to act on. Weeks or months of uptime means the top of the list is an average across every workload the server has run since it started, including the ones nobody is running any more.
Do Not Clear the Counters
The obvious shortcut is to reset them and look again:
-- Instance-wide. Think before running this on a shared server.
DBCC SQLPERF ('sys.dm_os_wait_stats', CLEAR);
It works, and it costs more than it looks. The reset is instance-wide, so anything else reading those counters loses its baseline at the same moment: a monitoring product, a collector job, a colleague mid-investigation. You also destroy the history rather than setting it aside, so the comparison you might want tomorrow is gone. It is a reasonable thing to do on a lab instance you own outright and a poor habit on production.
The snapshot approach gets you the same interval view and takes nothing away from anyone else.
Two Snapshots and a Subtraction
The method is simple enough to describe in one sentence: record the counters, wait, record them again, and report the difference. Generate-CollectorJob-WaitStats.sql in the repo creates a SQL Agent job that writes a snapshot into a collector table on a schedule, and Get-WaitStatsDelta.sql compares the two most recent snapshots and returns what actually accumulated between them.
The delta is the number worth arguing about. It answers “what is this server waiting on now“, which is the question you were asking when you opened the DMV.
Reading the Delta
Three columns carry most of the meaning, and one of them is easy to misread.
delta_wait_mssignal_pct: a high signal share across most of the top rows is CPU pressure, whatever the wait types are called.pct_of_total_waitdelta_tasks = 1 is one long wait, not a busy server.delta_tasksThe delta script applies no benign-wait filter, so the top row can still be housekeeping: the sample output it was first published with had QDS_ASYNC_QUEUE at the top with one task and a huge total. Look the type up in the library before acting on it, or apply the exclusion list from Get-WaitStatistics to the delta if you want the same filtered view over the window.
The Restart Trap
If the instance restarts between two snapshots, the counters reset to zero and the later snapshot is smaller than the earlier one. Subtracting produces a negative number, or worse, a plausible small one. Any delta script worth running checks sqlserver_start_time on both snapshots and refuses to calculate when it changed, which is the behaviour you want: a refusal you can see beats a number you cannot trust.
The same applies if somebody cleared the counters manually in between, which is a second reason not to make a habit of clearing them.
Common Questions
How long should the interval be?
Can I just run the DMV twice by hand instead of a collector job?
Why is my top wait something I have never heard of?
Does the delta approach work across a failover?
Should I still look at the cumulative numbers at all?
Related Scripts
- SQL Server Wait Types Library, what each wait type actually means, and whether it is worth chasing
- SQL Server Is Slow: What to Check First, in Order, the incident that sends you here, with the interval reading in step 3
- Collect Performance Baselines, the collector jobs that take the snapshots this post relies on
- Run a Full SQL Server Health Check, when the question is broader than waits
- SQL Server High CPU, the walkthrough that decides working versus waiting before any setting is touched
Leave a Reply