
Every time a SQL Server session has to wait for something, a lock, a page from disk, a CPU slice, a memory grant, the engine records what it waited on and for how long. Those counters are the instance’s own diary of where time goes, and reading them is the quickest way to find out what kind of pressure a server is actually under.
The problem is that sys.dm_os_wait_stats mixes the signal in with hundreds of idle and background waits that mean nothing for troubleshooting. This script filters the noise out and returns the top 20 waits that actually matter, with percentages and signal-versus-resource splits so the story is readable at a glance.
This post covers the script itself. For what each individual wait type means, the full reference lives in the SQL Server Wait Statistics library, which documents hundreds of wait types with causes and fixes.
Why Wait Statistics Matter
Wait statistics are the first stop in almost every SQL Server performance investigation, because they tell you which subsystem to look at before you start guessing. High PAGEIOLATCH_* waits point at storage, LCK_M_* at blocking, SOS_SCHEDULER_YIELD and high signal waits at CPU, RESOURCE_SEMAPHORE at memory grants.
Starting anywhere else means picking a subsystem on instinct. Starting with waits means the instance tells you where it hurts, and everything after that is confirmation rather than exploration.
When to Run This Script
- Routine SQL Server health checks
- At the start of any performance investigation, before deeper query-level analysis
- After a workload change or migration, to compare the wait profile against the old baseline
- When the server feels slow but no single query stands out
The Script
Run the following script against your SQL Server instance.
- Tested on: SQL Server 2025 (RTM CU8), Windows lab instance
- Last verified: 2026-08-31 (saved output from a real run, Get-WaitStatistics-20260831-014344.csv)
- Permissions: VIEW SERVER STATE
- Safety: read-only, impact low
/*
Script Name : Get-WaitStatistics
Category    : performance-troubleshooting
Purpose     : Top wait types since last SQL Server restart, filtered to actionable waits only.
Author      : Peter Whyte (https://sqldba.blog/sql-server-wait-statistics/)
Requires    : VIEW SERVER STATE
HealthCheck : Yes
*/
-- SAFE:ReadOnly
-- IMPACT:Low
SET NOCOUNT ON;

WITH filtered_waits AS (
    SELECT
        wait_type,
        waiting_tasks_count,
        wait_time_ms,
        max_wait_time_ms,
        signal_wait_time_ms,
        wait_time_ms - signal_wait_time_ms AS resource_wait_time_ms
    FROM sys.dm_os_wait_stats
    WHERE waiting_tasks_count > 0
      AND wait_type NOT IN (
          -- Idle / background scheduler waits — not indicative of workload pressure
          'SLEEP_TASK',                     'SLEEP_SYSTEMTASK',
          'SLEEP_TEMPDBSTARTUP',            'SLEEP_DBSTARTUP',
          'SLEEP_DCOMSTARTUP',              'SLEEP_MASTERDBREADY',
          'SLEEP_MASTERMDREADY',            'SLEEP_MASTERUPGRADED',
          'SLEEP_MSDBSTARTUP',              'SNI_HTTP_ACCEPT',
          'DISPATCHER_QUEUE_SEMAPHORE',     'BROKER_TO_FLUSH',
          'BROKER_TASK_STOP',               'BROKER_EVENTHANDLER',
          'BROKER_RECEIVE_WAITFOR',         'CHECKPOINT_QUEUE',
          'DBMIRROR_EVENTS_QUEUE',          'DBMIRROR_WORKER_QUEUE',
          'SQLTRACE_INCREMENTAL_FLUSH_SLEEP','SQLTRACE_BUFFER_FLUSH',
          'SQLTRACE_WAIT_ENTRIES',          'WAITFOR',
          'LAZYWRITER_SLEEP',               'LOGMGR_QUEUE',
          'ONDEMAND_TASK_QUEUE',            'REQUEST_FOR_DEADLOCK_SEARCH',
          'RESOURCE_QUEUE',                 'SERVER_IDLE_CHECK',
          'SP_SERVER_DIAGNOSTICS_SLEEP',    'WAIT_XTP_OFFLINE_CKPT_NEW_LOG',
          'XE_DISPATCHER_WAIT',             'XE_TIMER_EVENT',
          'HADR_WORK_QUEUE',                'HADR_FILESTREAM_IOMGR_IOCOMPLETION',
          'HADR_CLUSAPI_CALL',              'HADR_NOTIFICATION_DEQUEUE',
          'FT_IFTS_SCHEDULER_IDLE_WAIT',    'FT_IFTSHC_MUTEX',
          'REPL_WORK_QUEUE',                'CLR_AUTO_EVENT',
          'CLR_MANUAL_EVENT',               'WAIT_XTP_COMPILE_WAIT',
          -- Idle / background waits introduced SQL Server 2016–2022
          'SOS_WORK_DISPATCHER',            'PREEMPTIVE_XE_DISPATCHER',
          'PREEMPTIVE_XE_GETTARGETSTATE',   'DIRTY_PAGE_POLL',
          'QDS_PERSIST_TASK_MAIN_LOOP_SLEEP','QDS_ASYNC_QUEUE',
          'QDS_CLEANUP_STALE_QUERIES_TASK_MAIN_LOOP_SLEEP',
          'QDS_SHUTDOWN_QUEUE',             'PWAIT_EXTENSIBILITY_CLEANUP_TASK',
          'PARALLEL_REDO_WORKER_WAIT_WORK', 'HADR_TIMER_TASK',
          'PVS_PREALLOCATE',                'XE_LIVE_TARGET_TVF',
          'WAIT_XTP_HOST_WAIT'
      )
)
SELECT TOP 20
    wait_type,
    waiting_tasks_count,
    wait_time_ms,
    CAST(100.0 * wait_time_ms / NULLIF(SUM(wait_time_ms) OVER (), 0) AS DECIMAL(5,2)) AS pct_total_wait,
    CAST(wait_time_ms / NULLIF(waiting_tasks_count, 0) AS DECIMAL(10,0))              AS avg_wait_ms,
    max_wait_time_ms,
    signal_wait_time_ms,
    resource_wait_time_ms
FROM filtered_waits
ORDER BY wait_time_ms DESC;
It reads sys.dm_os_wait_stats, excludes the idle and background wait types, and returns the top 20 remaining waits with each one’s share of total wait time and its signal-versus-resource split.
How To Run From The Repo
Clone DBA Tools, initialize and run the script:
# Clone dba-tools repo:
git clone https://github.com/peterwhyte-lgtm/dba-tools

# Initialize environment:
cd dba-tools
.\Initialize-Environment.ps1

# Check top wait types since last restart:
.\run.ps1 Get-WaitStatistics

# To run against a remote sql server:
.\run.ps1 Get-WaitStatistics -ServerInstance SQLSERVER01
This script lives in the repo at:
Example Output
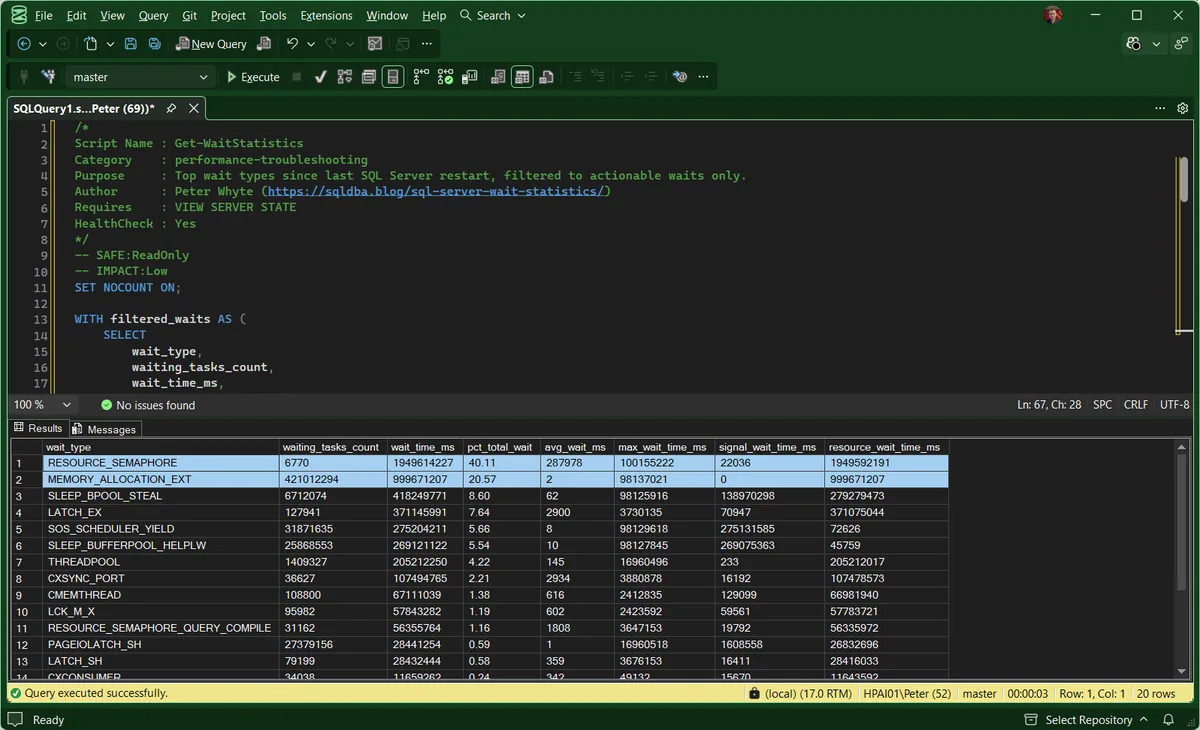
The result set shows the top wait types ordered by total wait time, with each type’s percentage of overall waits and the split between signal time and resource time.
This is a test instance, so your own profile will look different. Read the top few percentages first, see what the server is spending most of its time waiting on, then follow that into the matching troubleshooting guide. Take it as a hint rather than a diagnosis, sometimes a strong one, sometimes a small clue.
Understanding the Results
pct_total_wait is the column to read first. A healthy instance usually spreads its waits; a stressed one concentrates them, and one wait type holding 40 percent or more of total wait time is a clear lead worth chasing.
avg_wait_ms separates frequent-but-tiny waits from rare-but-painful ones. A million waits averaging under a millisecond is often normal machinery, while a few thousand waits averaging seconds each is someone’s query stalling.
signal_wait_time_ms versus resource_wait_time_ms answers a different question: signal time is how long tasks sat runnable waiting for a CPU slice after their resource arrived. When signal time is a large share of a wait’s total, the deeper issue is CPU scheduling pressure rather than the resource named in the wait type.
For what any specific wait type means and how to fix it, look it up in the wait statistics library, which has a dedicated page per wait with causes, thresholds and fixes.
Best Practices
- Measure deltas, not lifetime totals. The counters accumulate since the last restart, so an instance up for months carries months of history. For an incident, capture the output twice, ten minutes apart, and compare; the difference is what is happening now.
- Baseline when things are fine. The wait profile on a good day is the only fair comparison for a bad day.
- Reset deliberately when needed.
DBCC SQLPERF('sys.dm_os_wait_stats', CLEAR);zeroes the counters, which is useful after a config change, but note it clears the history for everyone. - Do not chase a wait just because it is top. Every instance always has a top wait. It only matters if the percentage is dominant, the average is high, or it changed against your baseline.
Microsoft’s reference covers sys.dm_os_wait_stats and DBCC SQLPERF in full.
Related Scripts
You may also find these scripts useful:
- Query and Performance Tuning (hub)
- Backup Restore Progress
- Cumulative Wait Stats Lie: Measuring Waits Over an Interval
- Database I/O Usage
- Table Sizes
- Troubleshoot RESOURCE_SEMAPHORE Waits
- DBA Scripts: The Complete Guide, the map across every script on this site
Frequently Asked Questions
What are wait statistics in SQL Server?
They are cumulative counters of everything sessions have waited on since the instance started, exposed through sys.dm_os_wait_stats. They are the standard starting point for working out whether an instance is bound by CPU, storage, locking or memory.
How do I reset wait statistics?
Run DBCC SQLPERF('sys.dm_os_wait_stats', CLEAR);. The counters also reset when SQL Server restarts. Reset deliberately, ideally after a change you want to measure, because the cleared history cannot be recovered.
Which wait types can I ignore?
The idle and background waits this script already filters out, things like LAZYWRITER_SLEEP, CHECKPOINT_QUEUE and the SLEEP_* family. For anything that survives the filter, check its page in the wait library before deciding it is benign.
Summary
Wait statistics are the instance telling you where its time went, and this script turns that raw diary into a readable top-20 with the noise already removed. Read the percentage column for the headline, the averages for the pain level, and the signal split for hidden CPU pressure.
It runs as part of the dba-tools health check for a reason: a wait profile you glance at weekly is what makes the odd spike unmissable. And when a specific wait needs explaining, the wait statistics library carries the per-wait detail so this post does not have to.
Leave a Reply