
A SQL Server that runs out of disk stops taking writes, and depending on which volume filled up, that can mean suspended databases, a frozen transaction log, or failed backups at exactly the wrong moment. Disk space is the least glamorous thing a DBA monitors and the single most common cause of a 2am callout.
The catch for DBAs is access. On many production servers you have SQL access but not an RDP session, so checking drive space “the normal way” is not an option. Fortunately SQL Server can report on the volumes it uses by itself.
This script queries sys.dm_os_volume_stats through T-SQL alone and returns one row per volume hosting database files: total, free, used, and free percentage, most-full volume first.
Why Disk Space Matters
SQL Server does not degrade gracefully when a volume fills. A full data volume means autogrow fails and inserts start throwing errors. A full log volume freezes every write in the database with error 9002, and if that database is tempdb, the whole instance is effectively down. A full backup target quietly breaks your recovery point until someone notices the failed jobs.
The free_pct column is your early-warning line, but the free GB matters just as much: 10% free on a 4TB volume is plenty of runway, while 10% on a 100GB volume can vanish inside one index rebuild. Judge both together, in the context of how fast your databases grow.
- Full data volume: autogrow fails, writes error out
- Full log volume: transactions freeze with error 9002
- Full backup volume: recovery point drifts silently
When to Run This Script
- Routine SQL Server health checks
- When autogrow failures or error 9002 (transaction log full) appear
- Before large operations: index rebuilds, bulk loads, big restores
- During capacity planning, alongside database growth trends
- On servers where you have SQL access but no OS/RDP access
The Script
Run the following script against your SQL Server instance.
/*
Script Name : Get-DiskSpace
Category    : storage-capacity-management
Purpose     : Show free and used space per volume that hosts SQL Server database files.
Author      : Peter Whyte (https://sqldba.blog/dba-scripts-get-disk-space/)
Requires    : VIEW SERVER STATE
Notes       : Uses sys.dm_os_volume_stats — shows only volumes with at least one database
              file. For OS-level disk summary across all drives use Get-DiskSpaceSummary.ps1.
HealthCheck : Yes
*/
-- SAFE:ReadOnly
-- IMPACT:Low
SET NOCOUNT ON;

-- Group on the volume identity only: total/available bytes can change between file
-- samples mid-query, which duplicated volume rows when they were in the GROUP BY.
SELECT
    vs.volume_mount_point,
    vs.logical_volume_name,
    CAST(MAX(vs.total_bytes)     / 1024.0 / 1024 / 1024 AS DECIMAL(10,2)) AS total_gb,
    CAST(MIN(vs.available_bytes) / 1024.0 / 1024 / 1024 AS DECIMAL(10,2)) AS free_gb,
    CAST((MAX(vs.total_bytes) - MIN(vs.available_bytes)) / 1024.0 / 1024 / 1024
         AS DECIMAL(10,2))                                                AS used_gb,
    CAST(100.0 * MIN(vs.available_bytes) / NULLIF(MAX(vs.total_bytes), 0)
         AS DECIMAL(5,1))                                                 AS free_pct
FROM sys.master_files AS mf
CROSS APPLY sys.dm_os_volume_stats(mf.database_id, mf.file_id) AS vs
GROUP BY vs.volume_mount_point, vs.logical_volume_name
ORDER BY free_pct ASC;
It resolves every database file to its hosting volume and returns one deduplicated row per volume, ordered so the fullest disk is at the top.
How To Run From The Repo
Clone DBA Tools, initialize and run the script:
# Clone dba-tools repo:
git clone https://github.com/peterwhyte-lgtm/dba-tools

# Initialize environment:
cd dba-tools
.\Initialize-Environment.ps1

# Check free disk space on SQL Server volumes:
.\run.ps1 Get-DiskSpace

# To run against a remote sql server:
.\run.ps1 Get-DiskSpace -ServerInstance SQLSERVER01
This script lives in the repo at:
sql/monitoring/disk-space/Get-DiskSpace.sqlpowershell/wrappers/monitoring/disk-space/Get-DiskSpace.ps1
Example Output
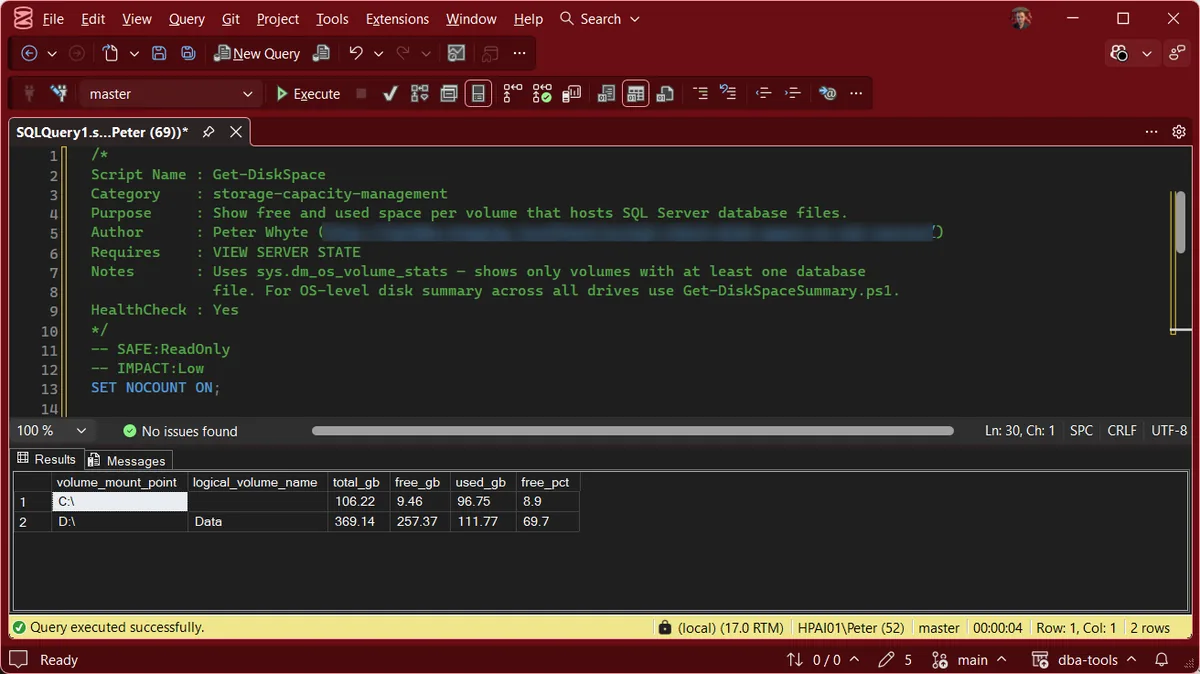
Run against the lab instance. 2 volumes come back, ordered fullest first, and they make the point better than a healthy server would.
C:\9.46 GB free of 106.22 GBD:\ Data257.37 GB free of 369.14 GBBands as used throughout this page: red under 10 percent free, amber 10 to 20 percent, green above. The proportion is the finding. A percentage tells you where you are, and the absolute free GB tells you how long you have.
Both rows are the same script and the same instance. The one that needs attention is the system drive, not the data drive, which is the case people are least likely to be watching for. Databases get monitored. C:\ fills up quietly behind them.
This example is a live capture and the top row is a genuine red alert: the C:\ volume hosting system databases has 1.2% free. That is the kind of finding this script exists to surface before SQL Server does it the hard way.
What This Script Cannot See
It only reports volumes that already hold a database file. sys.dm_os_volume_stats takes a database ID and a file ID, so SQL Server can only ask Windows about volumes it has files on. Your backup target, a staging area, a volume you are about to grow a file onto: none of them appear here, however full they are.
So a clean result means the volumes holding database files are fine. It does not mean the server has enough disk. For that you need an OS-level check, which is what Get-DiskSpaceSummary.ps1 in the repo is for.
On SAN storage, treat these numbers as what Windows believes. With thin provisioning the array can be far closer to full than the volume looks, because the capacity was promised rather than allocated. A LUN reports comfortable free space right up until the array cannot honour the next write. This script owns the operating system half of that answer; the storage team owns the other.
One note on the capture above, since it is my own instance: that is a local test box, and database files on C:\ is not what you would do on a real server. It is still the shape worth recognising, because the volume in trouble is the system drive and the data drive is the healthy one, and attention usually follows the databases.
Understanding the Results
free_pctfree_gbtotal_gbused_gbvolume_mount_pointC:\ is not the same volume as C:\ and is easy to misread as one. Microsoft note that this column returns NULL on Linux.logical_volume_nameOne blind spot worth knowing before you trust a clean result. sys.dm_os_volume_stats takes a database ID and a file ID, so it can only report on volumes that already hold a database file. A backup drive, a staging area or a volume you are about to grow a file onto will not appear here at all, no matter how full it is. That is a property of the function rather than a limitation of the script, and it is the reason this page pairs with an OS-level check.
Under 10% free, or under one growth-cycle of headroom: act now. Between autogrow events, log growth during index maintenance, and tempdb expansion, a volume in this band can fill mid-operation.
10 to 20% free: plan the expansion or cleanup this week rather than this quarter, especially on smaller volumes where the percentage overstates the runway.
Remember what this view cannot see. It only reports volumes hosting database files. Backup targets on separate volumes or UNC shares, and the OS drive if no database files live there, need OS-level monitoring (the repo’s Get-DiskSpaceSummary.ps1 covers local drives from PowerShell).
How to Free Disk Space on a SQL Server Volume
Find what grew. Database file sizes and free space inside each file tell you whether the space went to data, logs, or tempdb, and the repo’s database sizes script breaks that down per database.
Transaction logs are the usual suspect. A log that ballooned once (a huge delete, a stalled log backup chain, a long-running transaction) keeps that size forever until you shrink it deliberately. Fix the cause first, confirm log backups are running, then a one-off DBCC SHRINKFILE on the log is legitimate.
Do not shrink data files as routine maintenance. It fragments indexes and the space usually grows right back. Reserve it for genuine one-off reclaims after archiving or purging.
Check for non-database tenants. Old backup files, memory dumps, and forgotten copies of detached databases love living on SQL volumes.
Microsoft’s reference covers sys.dm_os_volume_stats, sys.master_files and DBCC SHRINKFILE in full.
Related Scripts
You may also find these scripts useful:
- Disk Is Full or the Log Will Not Truncate, step 1 of the space router, which drive is actually full
- Storage and Capacity (hub)
- Autogrowth History
- Database Free Space Summary
- Database Sizes and Free Space
- Database Files Detail
- Filegroup Space
- Database Growth Risk and Forecast
- VLF Counts
- How to Right-Size SQL Server Database Files
- DBA Scripts: The Complete Guide, the map across every script on this site
Common Questions
How do I check disk space in SQL Server without RDP access?
Query sys.dm_os_volume_stats, which reports total and available bytes for any volume hosting a database file. The script on this page wraps it into one row per volume, so plain T-SQL access is enough.
Why does the transaction log fill the disk?
Common causes are a broken or missing log backup chain in FULL recovery, one very large transaction, or a long-running transaction pinning the log. The log then keeps its grown size until deliberately shrunk after the cause is fixed.
What happens when a SQL Server disk is full?
Files on that volume can no longer grow. Data file growth failures error individual inserts, a full transaction log freezes all writes in that database with error 9002, and a full tempdb volume degrades the entire instance.
Summary
Every SQL Server outage caused by a full disk was visible days earlier to anyone who looked. This script makes looking cheap: one query, one row per volume, fullest first, from inside SQL Server where DBAs actually have access.
It runs as part of the repo’s health-check collection for exactly that reason. Watch the top row, judge percentage and absolute GB together, and treat a shrinking number on a log volume as an incident in progress rather than a trend to watch.
Leave a Reply