
When a SQL Server is struggling and the usual suspects (CPU, memory, blocking) come back clean, the next question is always the same: which database is hammering the disks? On a busy instance hosting ten or twenty databases, gut feeling is not an answer. You need the actual read/write numbers, per database, with the latency to go with them.
SQL Server keeps exactly that in sys.dm_io_virtual_file_stats, accumulated since the last restart. The raw DMV output is per file and awkward to read, so this script rolls it up into one row per database with each database’s percentage share of total reads, writes, and I/O stall time. The database eating your storage becomes obvious in one result set.
Why Database I/O Usage Matters
Storage is the slowest part of any SQL Server, and I/O stall time is where that shows up. Every millisecond a query spends waiting on a read or write is a millisecond added to someone’s report, batch job, or web request. Knowing which database drives that wait is the difference between fixing the right thing and tuning blind.
The percentage share columns matter more than the raw totals. A database doing 60% of all reads on the instance is where your buffer pool, your indexing effort, and your storage budget should be pointing. It also settles the classic shared-instance argument: when the storage team says “your SQL Server is thrashing the SAN”, this output tells you which database, and by extension which application, is responsible.
- Capacity planning: which databases earn faster storage or their own instance
- Performance triage: whether the slow database is actually the busy one, or the victim of a noisy neighbour
- Chargeback and consolidation decisions backed by real numbers
When to Run This Script
- Routine SQL Server health checks
- When storage latency alerts fire and you need the responsible database
- When
PAGEIOLATCH_*orWRITELOGwaits dominate your wait statistics - Before migrating or consolidating instances, to profile each database’s I/O appetite
- After a release, to catch a new query pattern driving unexpected read volume
The Script
Run the following script against your SQL Server instance.
- Tested on: SQL Server 2025 (RTM CU8), Windows lab instance
- Last verified: 2026-08-30 (saved output from a real run, Get-DatabaseIoUsage-20260830-004748.csv)
- Permissions: VIEW SERVER STATE
- Safety: read-only, impact low
/*
Script Name : Get-DatabaseIoUsage
Category    : performance-troubleshooting
Purpose     : Database I/O totals with percentage share, MB read/written, and latency breakdown.
Author      : Peter Whyte (https://sqldba.blog/dba-scripts-get-database-io-usage/)
Requires    : VIEW SERVER STATE
HealthCheck : Yes
*/
-- SAFE:ReadOnly
-- IMPACT:Low
SET NOCOUNT ON;

WITH io_stats AS
(
    SELECT
        vfs.database_id,
        SUM(vfs.num_of_reads)                AS total_reads,
        SUM(vfs.num_of_writes)               AS total_writes,
        SUM(vfs.num_of_bytes_read)           AS total_bytes_read,
        SUM(vfs.num_of_bytes_written)        AS total_bytes_written,
        SUM(vfs.io_stall_read_ms)            AS total_read_stall_ms,
        SUM(vfs.io_stall_write_ms)           AS total_write_stall_ms
    FROM sys.dm_io_virtual_file_stats(NULL, NULL) vfs
    GROUP BY vfs.database_id
),

totals AS
(
    SELECT
        SUM(total_reads)          AS grand_total_reads,
        SUM(total_writes)         AS grand_total_writes,
        SUM(total_read_stall_ms)  AS grand_total_read_stall_ms,
        SUM(total_write_stall_ms) AS grand_total_write_stall_ms
    FROM io_stats
)
SELECT
    DB_NAME(io.database_id) AS database_name,
    io.total_reads,
    CAST(100.0 * io.total_reads / NULLIF(t.grand_total_reads, 0) AS DECIMAL(6,2)) AS pct_total_reads,
    io.total_writes,
    CAST(100.0 * io.total_writes / NULLIF(t.grand_total_writes, 0) AS DECIMAL(6,2)) AS pct_total_writes,
    io.total_bytes_read / 1024 / 1024 AS total_mb_read,
    io.total_bytes_written / 1024 / 1024 AS total_mb_written,
    io.total_read_stall_ms,
    CAST(100.0 * io.total_read_stall_ms / NULLIF(t.grand_total_read_stall_ms, 0) AS DECIMAL(6,2)) AS pct_total_read_stall,
    io.total_write_stall_ms,
    CAST(100.0 * io.total_write_stall_ms / NULLIF(t.grand_total_write_stall_ms, 0) AS DECIMAL(6,2)) AS pct_total_write_stall
FROM io_stats io
CROSS JOIN totals t
ORDER BY pct_total_write_stall DESC;
It aggregates sys.dm_io_virtual_file_stats across every file of every database and returns one row per database: read/write counts, MB moved, stall time, and each database’s percentage share of the instance totals.
How To Run From The Repo
Clone DBA Tools, initialize and run the script:
# Clone dba-tools repo:
git clone https://github.com/peterwhyte-lgtm/dba-tools

# Initialize environment:
cd dba-tools
.\Initialize-Environment.ps1

# Check database I/O usage across the instance:
.\run.ps1 Get-DatabaseIoUsage

# To run against a remote sql server:
.\run.ps1 Get-DatabaseIoUsage -ServerInstance SQLSERVER01
This script lives in the repo at:
Example Output
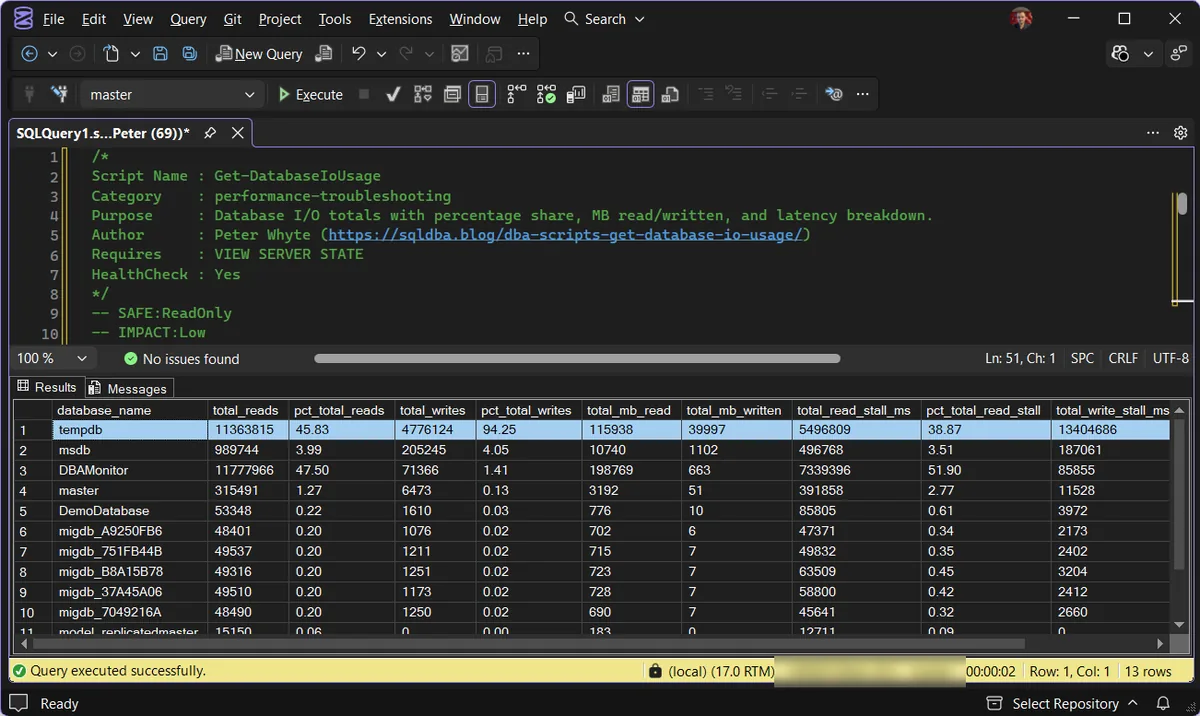
One thing worth calling out in this capture: tempdb tops both columns, with 45.83% of reads and 94.25% of writes. That is a different problem to a user database dominating the I/O. A user database at the top points at its application, its queries and its indexes.
tempdb at the top is an instance-wide symptom. The usual drivers are sort and hash spills from under-sized memory grants, heavy temp table and table variable churn, and the version store when snapshot isolation or RCSI is in play.
The fix lives in the workload feeding tempdb rather than in any one database, so pair this output with a memory grant spill check and a look at tempdb file configuration before blaming the storage.
| database_name | total_reads | pct_total_reads | total_writes | pct_total_writes | total_mb_read | total_mb_written | total_read_stall_ms | pct_total_read_stall | total_write_stall_ms | pct_total_write_stall |
|---|---|---|---|---|---|---|---|---|---|---|
| master | 5767 | 5.81 | 423 | 8.26 | 76 | 3 | 3573282 | 96.43 | 1932 | 27.11 |
| RandomLab | 4410 | 4.44 | 312 | 6.09 | 96 | 2 | 7987 | 0.22 | 1220 | 17.12 |
| tempdb | 1776 | 1.79 | 770 | 15.03 | 27 | 8 | 4818 | 0.13 | 603 | 8.46 |
| migdb_751FB44B | 4363 | 4.40 | 210 | 4.10 | 56 | 1 | 4590 | 0.12 | 299 | 4.20 |
| testlocal_006_F96600D9 | 4305 | 4.34 | 167 | 3.26 | 56 | 1 | 3998 | 0.11 | 205 | 2.88 |
| DemoDatabase | 4277 | 4.31 | 126 | 2.46 | 58 | 0 | 7064 | 0.19 | 203 | 2.85 |
| testlocal_005_1BDC6F19 | 4237 | 4.27 | 168 | 3.28 | 56 | 1 | 4864 | 0.13 | 194 | 2.72 |
| model_replicatedmaster | 1015 | 1.02 | 347 | 6.77 | 18 | 3 | 592 | 0.02 | 189 | 2.65 |
The result set shows every database’s cumulative I/O since the last restart, with the percentage columns making the heavy hitters obvious at a glance. Sorted by write stall share here, though re-sorting by any of the percentage columns answers a different triage question.
Understanding the Results
database_nametotal_readstotal_writespct_total_readspct_total_writestotal_mb_readtotal_mb_writtentotal_read_stall_mstotal_write_stall_mspct_total_read_stallpct_total_write_stallThe most useful derived number is average latency: total_read_stall_ms / total_reads gives you milliseconds per read for that database. Under 10ms is healthy for data files, 10 to 20ms is worth watching, and sustained values beyond that mean the storage is struggling or the database is asking too much of it.
Treat the numbers above as starting points, not limits. Baseline these latencies on your own hardware during a normal week; the thresholds worth acting on are the ones your workload proves.
Watch for share mismatches. A database with 5% of the reads but 60% of the read stall is sitting on slower storage than the rest, or its I/O pattern (large scans, for example) is harder for the storage to serve. That mismatch is a finding on its own, independent of raw volume.
One caveat: these counters accumulate from the last restart, so a database that was hammered last month and is quiet today still carries the history. Check sqlserver_start_time in sys.dm_os_sys_info when deciding how much history you are looking at.
How to Reduce Heavy Database I/O
Confirm the pattern first. High reads with low stall percentage is a busy but healthy database. High stall share is the actual problem, so start with the database topping the stall columns, not the operation counts.
Look at memory before storage. Excessive physical reads often mean the working set does not fit in the buffer pool. Check page life expectancy and consider whether max server memory has headroom before blaming the disks.
Find the queries behind the volume. Large scans drive read volume, and missing indexes drive large scans. Pair this output with a missing-index check and your top-queries-by-reads list for the offending database.
Separate the log if write stall dominates. WRITELOG pain and high write stall on a shared volume usually means transaction log files competing with data files. Logs want low-latency sequential storage of their own.
Microsoft’s reference covers sys.dm_io_virtual_file_stats and sys.dm_os_sys_info in full.
Related Scripts
You may also find these scripts useful:
- Query and Performance Tuning (hub)
- Backup Restore Progress
- Table Sizes
- Wait Statistics
- DBA Scripts: The Complete Guide, the map across every script on this site
Frequently Asked Questions
How do I find which database is using the most I/O in SQL Server?
Query sys.dm_io_virtual_file_stats, which tracks cumulative reads, writes, and stall time per database file since the last restart. The script on this page aggregates it per database with percentage shares, so the heaviest database is the first row.
What is I/O stall in SQL Server?
Stall is the total time SQL Server spent waiting for I/O requests to complete. Dividing stall milliseconds by the operation count gives average latency, and sustained averages above roughly 20ms on data files point to storage under pressure.
Do these counters reset?
They reset when SQL Server restarts (and for tempdb, when it is recreated at startup). For trending, capture the output on a schedule and diff the snapshots rather than reading the cumulative totals.
Summary
I/O triage without numbers is guesswork, and this script replaces the guesswork with one result set: who reads, who writes, and who waits. The percentage columns answer the political questions (which application is loading the SAN) while the stall columns answer the technical one (where the time is going).
I run this as part of routine health checks and any time storage latency comes up. The single most valuable habit is computing average latency per database and watching for the share mismatches, because those point at real storage problems rather than just busy applications.
Leave a Reply