
SQL Server uses a cooperative scheduling model. Rather than relying on the OS to preempt threads, SQL Server threads voluntarily yield the CPU at natural checkpoints after roughly 4ms of execution. When a thread yields, it moves to the runnable queue and waits for the scheduler to give it CPU time again. SOS_SCHEDULER_YIELD records that wait.
Some of this is normal and expected, it is how the cooperative scheduler works. High values, especially alongside elevated signal_wait_time_ms in the overall wait stats output, indicate the CPU schedulers are overloaded and threads are waiting longer than usual for their turn.
Is This Wait Expected?
Some SOS_SCHEDULER_YIELD is always present. It is part of the scheduler’s normal operation. It becomes a signal when:
- It is your #1 or #2 wait type by
pct_total_wait, measured over an interval rather than the cumulative totals, which mostly describe whatever the instance has been doing since it last started signal_wait_time_msin your overall wait stats is a large fraction of total wait time (signal wait = time waiting for CPU after a resource became available)- CPU utilisation on the server is consistently above 80 to 90%
- Users report general sluggishness that does not correlate with a specific query or lock
When To Ignore It
Normal background cooperative yielding, a small amount of SOS_SCHEDULER_YIELD is inherent in how SQL Server schedules work. If it is in the top 10 but well below 10% of total wait time, it is probably just background noise.
During batch operations, large index rebuilds, DBCC CHECKDB, bulk loads, and columnstore compression all generate CPU work and consequently SOS_SCHEDULER_YIELD. Elevated values during known maintenance windows are expected.
On lightly loaded servers, the scheduler yields on every thread quantum, so even an idle server accumulates some of this wait. Look at pct_total_wait, if total wait time is low and SOS_SCHEDULER_YIELD is large only because other waits are also small, it is not a problem.
Root Causes
Five causes produce the same wait type. Each one leaves a different fingerprint, so work out which of these is yours before changing anything.
More runnable threads than the CPU cores can service. Every yield then results in a longer queue wait, because all schedulers are busy. This is the aggregate CPU pressure signal: it does not tell you which queries are responsible, only that the CPUs are overloaded.
Every scheduler shows runnable_tasks_count of 2 or more, and signal_wait_time_ms is a large share of total wait time across many wait types, not just this one.
A single query executing a tight, non-yielding loop of CPU work. It can monopolise one or more schedulers and starve everything else. A massive hash join, or an unindexed nested loop over millions of rows, is enough to be the sole cause.
One session’s cpu_time dwarfs every other row in sys.dm_exec_requests, and the runnable queue is concentrated on one or two schedulers rather than spread across all of them.
Parallel queries spawn many threads each. If several large parallel queries run at the same time, they can exhaust every scheduler even on a server with plenty of cores.
Many sessions are running parallel plans, and CXPACKET or CXCONSUMER sits near the top of the interval alongside SOS_SCHEDULER_YIELD rather than behind it.
Every active connection consuming CPU competes for a scheduler slot. This shows up during batch job spikes, or when connection pooling is misconfigured and far too many sessions are active at the same time.
A high count of simultaneously running requests, each using only modest CPU, and the spike lines up with a batch window rather than with any one expensive query.
A thread that stops yielding at all, through an infinite loop, blocking external code or a CLR problem, is eventually detected by the scheduler monitor. This is rare, and serious when it happens.
The error log carries message 17883, “Process … Worker … appears to be non-yielding on Scheduler …”, and the Windows Event Log carries it too. Nothing else on this list writes to the error log, so that line settles it, and it is the one cause here that needs looking at immediately rather than tuning.
How To Diagnose It
Check scheduler runnable queue depth:
SELECT
    scheduler_id,
    cpu_id,
    status,
    runnable_tasks_count,
    current_tasks_count,
    work_queue_count,
    pending_disk_io_count
FROM sys.dm_os_schedulers
WHERE status = 'VISIBLE ONLINE'
ORDER BY runnable_tasks_count DESC;
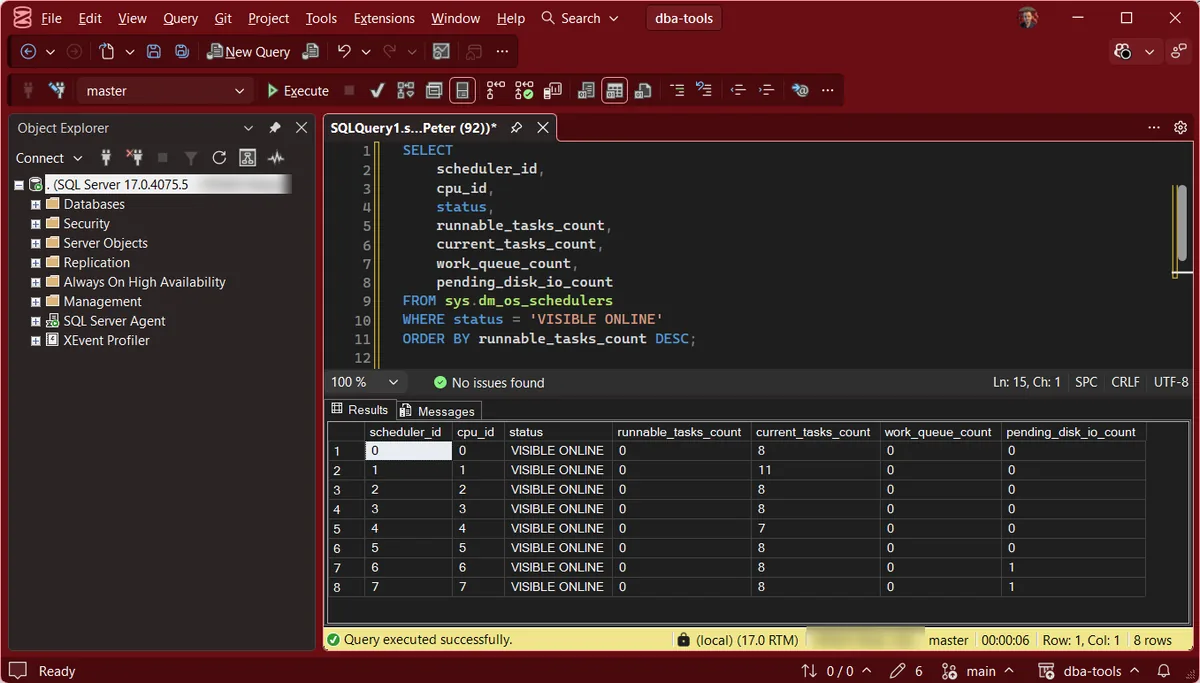
That capture is the healthy case, and it is worth knowing what it looks like: 8 schedulers online, every runnable_tasks_count at 0, so nothing is queuing for CPU at all. The current_tasks_count of 7 to 11 per scheduler is just work that is assigned there, not work that is waiting.
runnable_tasks_count > 1 on multiple schedulers means threads are piling up waiting for CPU. If every scheduler shows runnable_tasks_count >= 2, you have genuine CPU saturation.
Find current CPU-intensive queries:
SELECT TOP 20
    r.session_id,
    r.cpu_time,
    r.total_elapsed_time,
    r.logical_reads,
    r.scheduler_id,
    r.wait_type,
    SUBSTRING(t.text, (r.statement_start_offset / 2) + 1,
        ((CASE r.statement_end_offset WHEN -1 THEN DATALENGTH(t.text)
          ELSE r.statement_end_offset END - r.statement_start_offset) / 2) + 1) AS current_statement
FROM sys.dm_exec_requests r
CROSS APPLY sys.dm_exec_sql_text(r.sql_handle) t
WHERE r.status IN ('running', 'runnable')
ORDER BY r.cpu_time DESC;
Find historically CPU-expensive queries:
SELECT TOP 20
    qs.total_worker_time / qs.execution_count   AS avg_cpu_us,
    qs.total_worker_time,
    qs.execution_count,
    qs.total_logical_reads / qs.execution_count AS avg_logical_reads,
    SUBSTRING(qt.text, (qs.statement_start_offset / 2) + 1,
        ((CASE qs.statement_end_offset WHEN -1 THEN DATALENGTH(qt.text)
          ELSE qs.statement_end_offset END - qs.statement_start_offset) / 2) + 1) AS statement_text
FROM sys.dm_exec_query_stats qs
CROSS APPLY sys.dm_exec_sql_text(qs.sql_handle) qt
ORDER BY qs.total_worker_time DESC;
Queries with very high avg_cpu_us and high avg_logical_reads are the usual culprits, large scans doing CPU-intensive processing on the rows they touch.
Check signal_wait_time in context:
In the wait statistics script output, look at the signal_wait_time_ms column for all wait types. If signal wait is a large fraction of total wait time across the board (not just SOS_SCHEDULER_YIELD), the CPU schedulers are genuinely overloaded.
What To Do
In priority order. Step 1 fixes the cause; everything below it manages the symptom, and the last one costs money.
Step 1: Find and Tune the Top CPU Queries
This is almost always the right starting point, and it is the only step here that fixes the cause rather than the symptom. Pull the top 10 queries by total_worker_time from sys.dm_exec_query_stats, which is what Get Top CPU Queries does, with total and average CPU per statement.
Read their execution plans and look for scans that should be seeks. Adding the missing index converts a scan to a seek, and fewer rows read is less CPU burned. Get Missing Indexes lists the candidates the optimiser already wanted.
Then check the predicates. WHERE YEAR(date_column) = 2024 cannot use an index because the column is wrapped in a function; WHERE date_column >= '2024-01-01' AND date_column < '2025-01-01' can.
Step 2: Reduce MAXDOP and Raise the Cost Threshold
High parallelism amplifies CPU load: one query becomes eight threads competing for the same schedulers. If many queries are going parallel and the box is already saturated, lower max degree of parallelism and raise the cost threshold so only genuinely expensive queries go parallel at all.
MAXDOP and Cost Threshold covers what to set them to, and why the default cost threshold of 5 has been wrong since it was chosen.
Step 3: Stagger the Concurrent Workload
Check whether several batch jobs are scheduled to start at the same time. Overlapping index maintenance, a backup and an ETL window will saturate the CPUs between them while each one looks reasonable on its own. Spreading them across the hour costs nothing and often removes the spike entirely.
Step 4: Check for NUMA Imbalance
sys.dm_os_schedulers should show roughly equal runnable_tasks_count across schedulers. If one socket’s schedulers are consistently busier than the other’s, the load is not being spread and the NUMA configuration is worth checking before anyone buys hardware. Get CPU Topology shows the layout the scheduler numbers refer to.
Step 5: Only Then, Hardware
If the workload genuinely maxes out the CPUs and cannot be tuned further, more cores or faster cores are the answer. This step is last on purpose: buying cores to run an unindexed scan faster is the most expensive way to not fix a query. When you do add them, add them in a NUMA-balanced configuration, or the imbalance in step 4 becomes the new problem.
Related Scripts
- Get-WaitStatistics, the overview script; check signal_wait_time_ms column
- Get-TopCpuQueries, ranked CPU usage from the plan cache
- Get-CpuTopology, the scheduler and NUMA layout behind the yields
- Get-MissingIndexes, indexes reduce scan work and CPU load
- SQL Server High CPU, the walkthrough that decides working versus waiting before any setting is touched
Leave a Reply