
Someone says the server is slow and you want a look at it right now. Activity Monitor is already in SSMS: point it at the instance you are connected to and you get live CPU, waiting tasks, I/O, sessions and the most expensive recent queries, from your own desk, with no RDP session onto the server. Next to it in the same menu is the Performance Dashboard, a one-page report that does a similar job with a little more history behind it.
VIEW SERVER STATE. Use it for a first look. When you need to prove who is blocking whom or what the server has been waiting on, the scripts give you more, and output you can save.Open Activity Monitor
In Object Explorer, right-click the instance itself, the top node with the server name and version, and choose Activity Monitor. It opens as a new tab for that instance.
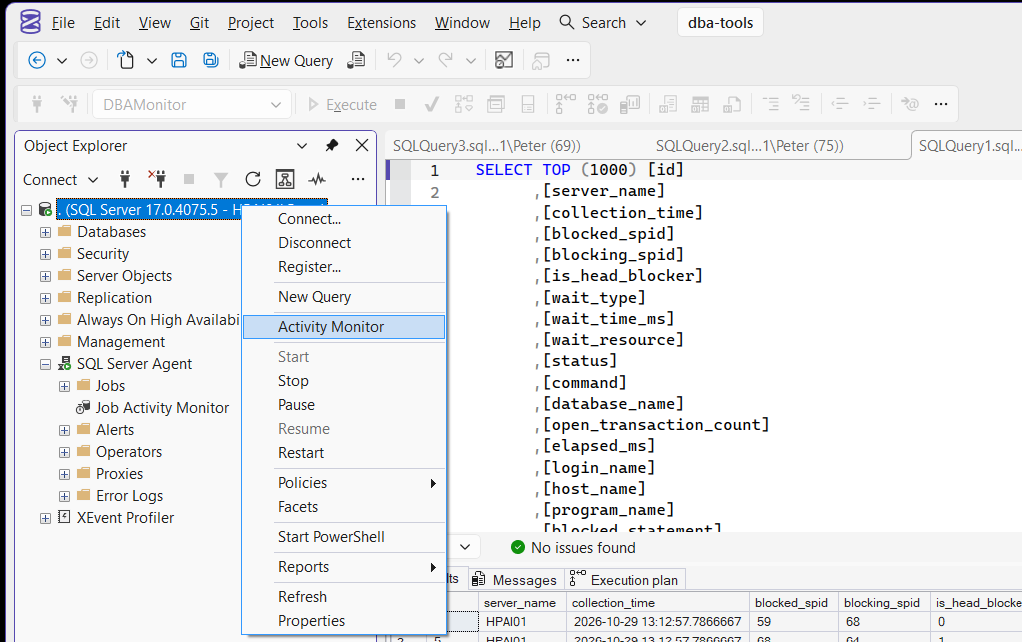
There is also an Activity Monitor icon on the Standard toolbar, which asks you to connect if you are not already. If you want it every time, MS Docs covers the startup option that opens Object Explorer and Activity Monitor together when SSMS starts.
What Each Pane Shows
The window is a stack of panes you expand and collapse. A pane only queries the server while it is expanded, so open the ones you need and leave the rest shut.
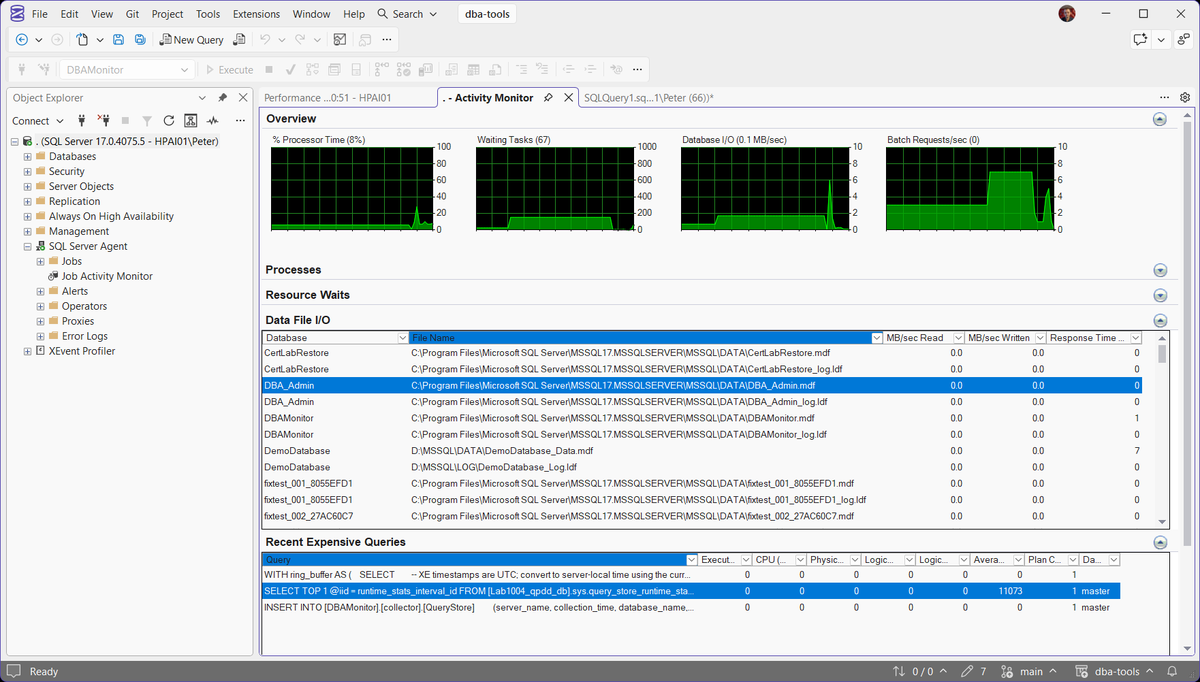
- Overview: 4 live graphs, % Processor Time, Waiting Tasks, Database I/O in MB/sec and Batch Requests/sec. The number in brackets on each title is the latest value.
- Processes: one row per session, with login, host, database, command, wait type and the session it is blocked by. Right-click a row for its details, the last statement it ran, or Kill Process.
- Resource Waits: what sessions are waiting on, grouped into categories such as Lock, Memory and Buffer I/O.
- Data File I/O: read and write MB/sec and response time for every database file on the instance.
- Recent Expensive Queries and Active Expensive Queries: the queries using the most CPU, reads and duration, recently finished and running now. Right-click one to open its text or its execution plan.
Every column can be sorted and filtered from its header, which is the quickest way to cut Processes down to one database or one login. The refresh interval is set by right-clicking Overview; MS Docs warns that anything under 10 seconds can itself affect performance on the server you are watching.
Permissions Activity Monitor Needs
You do not need to be sysadmin to use it. MS Docs lists 3 levels:
- See the activity:
VIEW SERVER STATE. - See the Data File I/O pane: also one of
CREATE DATABASE,ALTER ANY DATABASEorVIEW ANY DEFINITION. - Kill a process: membership of the
sysadminorprocessadminfixed server role.
That makes it a reasonable thing to hand a developer or a support team for a look without giving them any power to change anything. Grant VIEW SERVER STATE in SQL Server covers the grant, and what else the permission lets someone see.
Activity Monitor or a Script?
Activity Monitor earns its place because it is already there. No RDP session to the server, nothing to install, nothing to paste, and it is safe to point at production with the panes you are not using collapsed. For “is anything obviously on fire”, it is quick to answer.
Where it falls short is in the middle of an incident. It shows what is happening while the tab is open and keeps nothing afterwards, the Processes grid makes you trace a blocking chain by hand, and there is no output to save or paste into a ticket. That is when I would reach for a script instead:
| When you need | Run |
|---|---|
| Who is running what, right now | Get Active Sessions and Requests |
| Who is blocking whom, head blocker first | Get Blocking Chains |
| What the server has been waiting on | Get Wait Statistics |
| To end a session safely | How to Kill a SPID in SQL Server |
The SSMS Performance Dashboard
The Performance Dashboard is a built-in report rather than a live window, and it has been in SSMS since 17.2. Right-click the instance, then Reports, Standard Reports, Performance Dashboard. Once you have opened a report it also appears straight under Reports, as it does here.
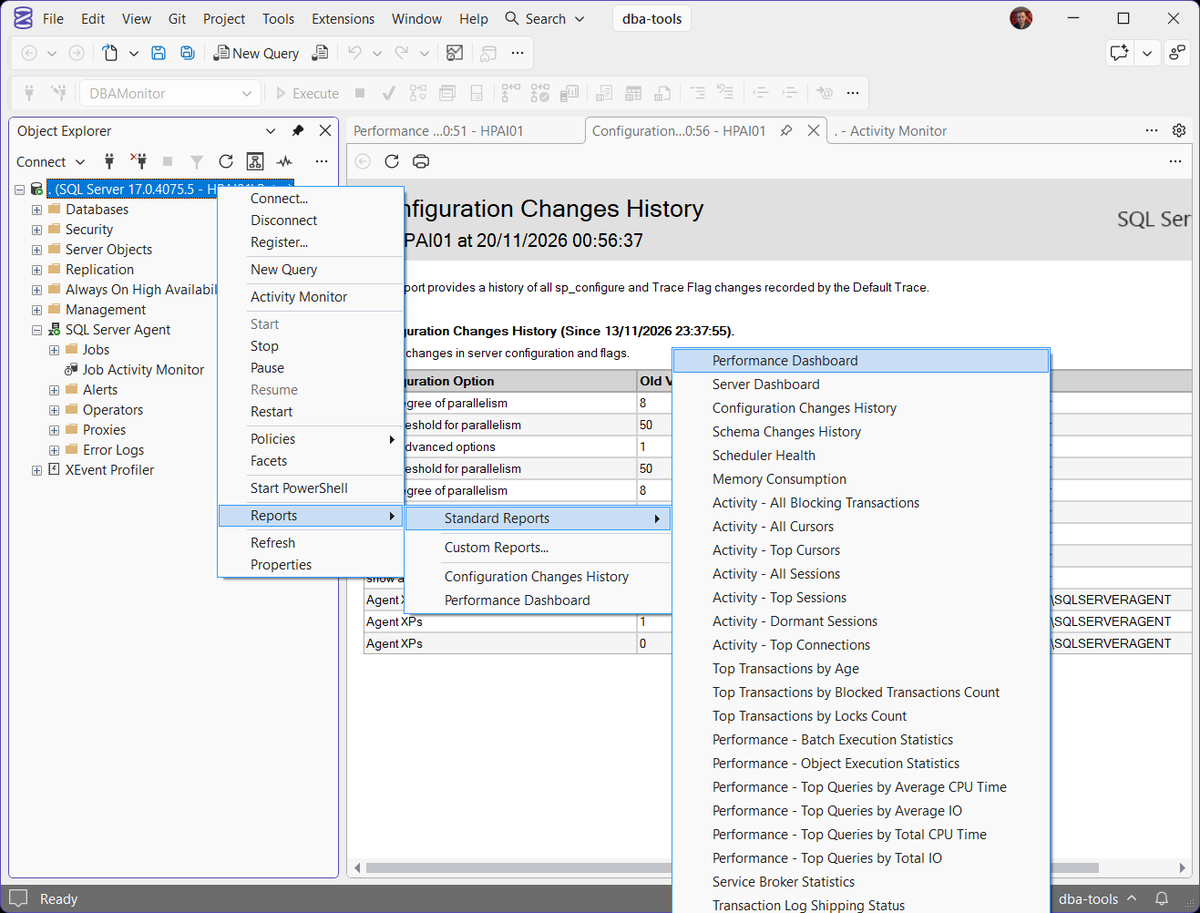
It needs VIEW SERVER STATE and ALTER TRACE, per MS Docs, one more permission than Activity Monitor.
Reading the Performance Dashboard
The top half answers the first 2 questions in any slowdown: is it CPU, and what is waiting.
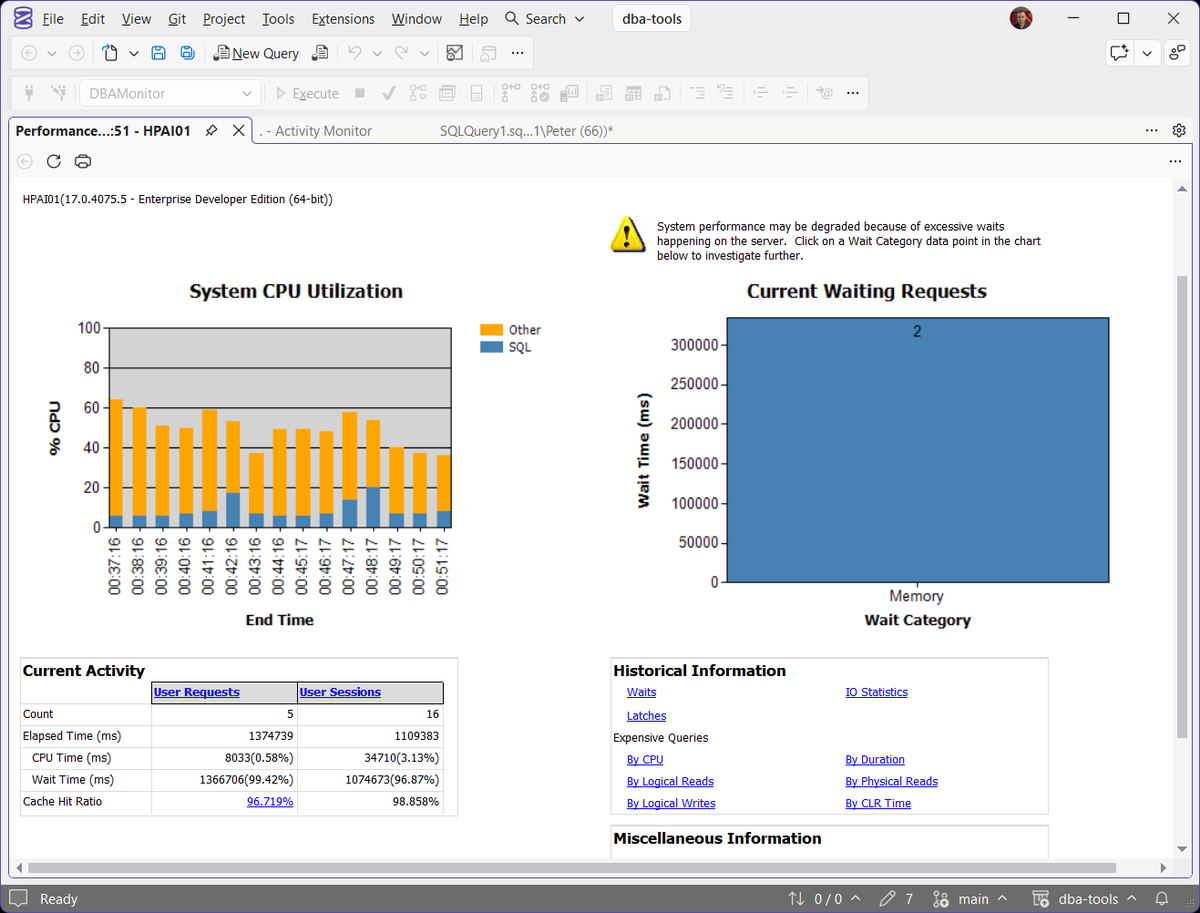
System CPU Utilization splits each minute into SQL and Other. On this instance, most of the CPU in every bar is Other, meaning something on the machine that is not SQL Server, which is worth knowing before you start tuning queries. Current Waiting Requests groups what is waiting right now by category, and here the dashboard has flagged excessive waits, all of them Memory. Click a bar to drill into the requests behind it. If it is Memory for you too, Get Memory Configuration and Usage is the next thing to run; if it is CPU, SQL Server High CPU: What to Check First.
Further down, Current Activity counts user requests and sessions, Historical Information links to waits, latches, I/O statistics and expensive queries by CPU, duration, reads and writes, and Miscellaneous Information lists active traces, Extended Events sessions, databases and missing indexes. 2 things to know about that last part:
- “Historical” means since the last restart. The expensive query reports read the plan cache DMVs, which are cleared when SQL Server restarts. For real history, use Query Store.
- Missing index suggestions are suggestions. Check each one against the indexes the table already has before creating anything.
For a Business-Critical Server, Monitor It Properly
Personally, I see both tools as something you open when you are already looking. If a server is important to the business, it should have monitoring dashboards with the basics always in view, CPU, memory, disk space, waits and blocking, with history behind them and an alert before anyone has to ring you. Activity Monitor will not tell you the log drive filled up at 3am. Between those dashboards, a regular health check catches the things that build up slowly.
Frequently Asked Questions
Where is Activity Monitor in SSMS?
Right-click the instance at the top of Object Explorer and choose Activity Monitor, or use the Activity Monitor icon on the Standard toolbar.
What permission does Activity Monitor need?
VIEW SERVER STATE to see activity. The Data File I/O pane also needs CREATE DATABASE, ALTER ANY DATABASE or VIEW ANY DEFINITION, and killing a process needs sysadmin or processadmin.
Does Activity Monitor slow the server down?
It runs its own queries against the instance for every expanded pane. At the default refresh that is light, but a refresh interval under 10 seconds can affect performance. Collapse the panes you are not reading and close the tab when you are done.
Can I kill a session from Activity Monitor?
Yes, right-click the row in Processes and choose Kill Process, if you are in sysadmin or processadmin. Check what the session is doing first: killing a session that is mid-transaction rolls it back, and a long rollback can take longer than the work did.
What is the difference between Activity Monitor and the Performance Dashboard?
Activity Monitor is a live window that refreshes while it is open. The Performance Dashboard is a report: a snapshot with links into waits, I/O and expensive queries since the last restart. Refresh it to see it again.
Related
- sp_who vs sp_who2 vs sp_whoisactive, the T-SQL answer to the Processes pane
- Troubleshoot SQL Server Blocking, Step by Step
- Measuring Waits Over an Interval, why a since-restart total can mislead
- SSMS Query Shortcuts, sp_whoisactive on a hotkey
- Get Long-Running Queries
- SSMS: The Complete Guide
Leave a Reply