
A single blocked session is usually easy to spot. The harder case is a chain: session C is waiting on session B, B is waiting on session A, and A is sitting idle holding a lock from a transaction nobody remembers is still open. Killing C does nothing. A is the problem, at the top of a chain that no single session’s wait state shows you.
This script traces every active blocking chain from head blocker down to the last waiting session, in one recursive query, so the actual root cause is visible immediately instead of pieced together session by session.
Why Blocking Chains Matters
Blocking is normal in any multi-user database; the problem is a blocker that doesn’t release in a reasonable time, and the chain of everyone waiting behind it:
- The head blocker, the session actually holding the lock everyone else is waiting on, is often several levels removed from the session a user or application is complaining about
- An idle head blocker (an open transaction that finished its last statement but never committed) is invisible in a simple active-requests view; this script surfaces it anyway via its last executed statement
downstream_waitersshows blast radius directly: a session blocking 10 others is a very different priority than one blocking 1- Chain depth and shape tell you whether this is a single stuck transaction or a genuine contention hotspot with many independent waiters
When to Run This Script
- Investigating reports of a slow or “hung” application
- Routine SQL Server health checks on busy OLTP systems
- Diagnosing a specific session that’s blocked, to find the actual root cause upstream
- After identifying elevated
LCK_%waits and needing to see the full picture, not just aggregate numbers
The Script
Run the following script against your SQL Server instance.
- Tested on: SQL Server 2025 (RTM CU8), Windows lab instance
- Last verified: 2026-10-23 (Get-BlockingChains run on the lab; the screenshot below is from it)
- Permissions: VIEW SERVER STATE
- Safety: read-only, impact low
/*
Script Name : Get-BlockingChains
Category    : diagnostics
Purpose     : Traces all active blocking chains using a recursive CTE. Returns
              every session involved in blocking — head blockers, mid-chain
              nodes, and leaf victims — ordered so each chain reads depth-first.
              Idle head blockers (sleeping but holding locks) are included; their
              last executed statement is recovered via sys.dm_exec_connections.
              Returns no rows when the server is not blocked.
Author      : Peter Whyte (https://sqldba.blog/dba-scripts-get-blocking-chains/)
Requires    : VIEW SERVER STATE

Performance note: dm_exec_requests is materialised into #ar once to avoid
repeated DMV scans. downstream_waiters is pre-aggregated rather than computed
via a correlated subquery. dm_exec_connections is joined only for sessions
that have no active request (idle head blockers).
*/
-- SAFE:ReadOnly
-- IMPACT:Low
SET NOCOUNT ON;

-- Materialise once — the recursive CTE and downstream count would otherwise
-- each trigger a separate scan of sys.dm_exec_requests.
DROP TABLE IF EXISTS #ar;

SELECT
    session_id, blocking_session_id, status, wait_type, wait_time,
    cpu_time, logical_reads, writes, total_elapsed_time,
    sql_handle, plan_handle, database_id,
    statement_start_offset, statement_end_offset
INTO #ar
FROM sys.dm_exec_requests
WHERE session_id <> @@SPID;

WITH
DownstreamCounts AS (
    SELECT blocking_session_id,
           COUNT(*) AS downstream_waiters
    FROM #ar
    WHERE blocking_session_id > 0
    GROUP BY blocking_session_id
),
Chain AS (
    -- Anchor: head blockers — block others but are not themselves blocked
    SELECT
        s.session_id AS chain_id,
        0 AS chain_level,
        CAST('head blocker' AS VARCHAR(16)) AS role,
        CAST(0 AS SMALLINT) AS blocker_session_id,
        s.session_id,
        s.login_name,
        s.host_name,
        s.program_name,
        s.open_transaction_count,
        COALESCE(r.status, s.status) AS status,
        r.wait_type,
        r.wait_time,
        r.cpu_time,
        r.logical_reads,
        r.writes,
        r.total_elapsed_time,
        COALESCE(r.database_id, s.database_id) AS database_id,
        COALESCE(r.statement_start_offset, 0) AS statement_start_offset,
        COALESCE(r.statement_end_offset, -1) AS statement_end_offset,
        -- Only fetch dm_exec_connections when there is no active request (idle blocker)
        COALESCE(r.sql_handle, c.most_recent_sql_handle) AS sql_handle,
        r.plan_handle
    FROM sys.dm_exec_sessions AS s
    LEFT JOIN #ar AS r ON r.session_id = s.session_id
    LEFT JOIN sys.dm_exec_connections AS c ON c.session_id = s.session_id
                                          AND r.session_id IS NULL
    WHERE s.is_user_process = 1
      AND EXISTS (SELECT 1 FROM #ar WHERE blocking_session_id = s.session_id)
      AND NOT EXISTS (SELECT 1 FROM #ar WHERE session_id = s.session_id AND blocking_session_id > 0)

    UNION ALL

    -- Recursive: victims blocked by the previous chain level
    SELECT
        ch.chain_id,
        ch.chain_level + 1,
        CAST('blocked' AS VARCHAR(16)),
        r.blocking_session_id,
        r.session_id,
        s.login_name,
        s.host_name,
        s.program_name,
        s.open_transaction_count,
        r.status,
        r.wait_type,
        r.wait_time,
        r.cpu_time,
        r.logical_reads,
        r.writes,
        r.total_elapsed_time,
        r.database_id,
        r.statement_start_offset,
        r.statement_end_offset,
        r.sql_handle,
        r.plan_handle
    FROM #ar AS r
    JOIN sys.dm_exec_sessions AS s ON s.session_id = r.session_id
    JOIN Chain AS ch ON ch.session_id = r.blocking_session_id
    WHERE r.blocking_session_id > 0
)
SELECT
    ch.chain_id,
    ch.chain_level,
    ch.role,
    ch.blocker_session_id,
    ch.session_id,
    ch.login_name,
    ch.host_name,
    ch.program_name,
    DB_NAME(ch.database_id) AS database_name,
    ch.open_transaction_count,
    ch.status,
    ch.wait_type,
    ISNULL(ch.wait_time, 0) AS wait_time_ms,
    ISNULL(ch.cpu_time, 0) AS cpu_time_ms,
    ISNULL(ch.logical_reads, 0) AS logical_reads,
    ISNULL(ch.writes, 0) AS writes,
    ISNULL(ch.total_elapsed_time, 0) AS total_elapsed_time_ms,
    ISNULL(dc.downstream_waiters, 0) AS downstream_waiters,
    CAST(
        (ISNULL(su.user_objects_alloc_page_count, 0) +
         ISNULL(su.internal_objects_alloc_page_count, 0)) * 8
    AS BIGINT) AS tempdb_allocations_kb,
    CAST(
        (ISNULL(su.user_objects_alloc_page_count, 0) - ISNULL(su.user_objects_dealloc_page_count, 0) +
         ISNULL(su.internal_objects_alloc_page_count, 0) - ISNULL(su.internal_objects_dealloc_page_count, 0)) * 8
    AS BIGINT) AS tempdb_current_kb,
    SUBSTRING(
        ISNULL(qt.text, ''),
        (ch.statement_start_offset / 2) + 1,
        CASE
            WHEN ch.statement_end_offset = -1
                THEN LEN(ISNULL(qt.text, ''))
            ELSE (ch.statement_end_offset - ch.statement_start_offset) / 2 + 1
        END
    ) AS sql_text
FROM Chain AS ch
LEFT JOIN DownstreamCounts AS dc ON dc.blocking_session_id = ch.session_id
LEFT JOIN sys.dm_db_session_space_usage AS su ON su.session_id = ch.session_id
OUTER APPLY sys.dm_exec_sql_text(ch.sql_handle) AS qt
ORDER BY
    ch.chain_id,
    ch.chain_level,
    ch.session_id
OPTION (MAXRECURSION 10);
The script materialises sys.dm_exec_requests once, then walks it with a recursive CTE from every head blocker (blocking others, not itself blocked) down through each level of victims, returning one row per session in each chain with its wait detail and the actual statement it’s running or last ran.
How To Run From The Repo
Clone DBA Tools, initialize and run the script:
# Clone dba-tools repo:
git clone https://github.com/peterwhyte-lgtm/dba-tools

# Initialize environment:
cd dba-tools
.\Initialize-Environment.ps1

# Trace all active blocking chains:
.\run.ps1 Get-BlockingChains

# To run against a remote sql server:
.\run.ps1 Get-BlockingChains -ServerInstance SQLSERVER01
This script lives in the repo at:
Example Output
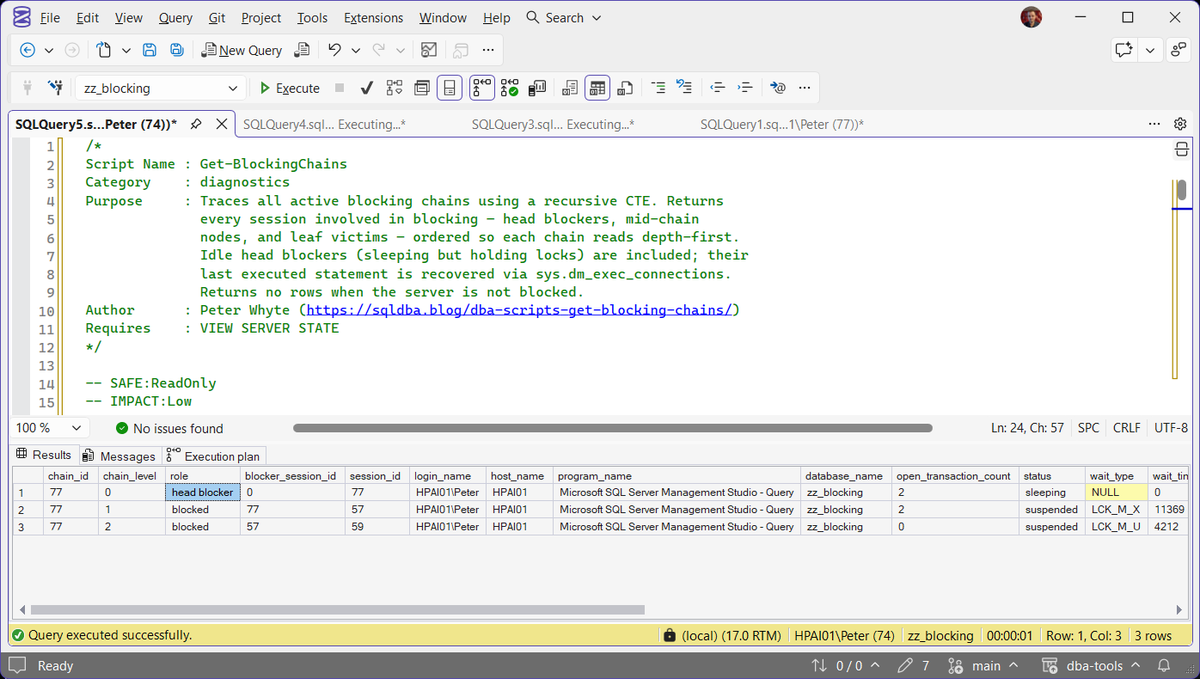
A 3-level chain. Session 77 is the actual root cause: idle (sleeping), with an open transaction from an earlier statement holding a lock that is blocking 57, which is itself blocking 59. Killing 59 would do nothing; 77 is the one to investigate.
Understanding the Results
chain_idchain_levelblocker_session_idblocker_session_id is the session directly above this one, and 0 on the head blocker.rolehead blocker is always the fix target. Everything else is a symptom of that session, not an independent problem.statusopen_transaction_countsleeping on a head blocker is the classic idle-transaction pattern: the session finished its last statement but never committed or rolled back. An open_transaction_count of 1 or more on the same row confirms the transaction is still open.Act when the head blocker is sleeping with an open transaction. Nothing is going to close it but the application or you, and the chain behind it grows until something does. Get Open Transactions shows how long it has been open.wait_typewait_time_msLCK_M_X or LCK_M_S (LCK_M_X, LCK_M_S, and LCK_M_U Wait Types in SQL Server). An idle head blocker has no request running, so it shows no wait at all.Act when the wait on the sessions at the bottom of the chain runs into minutes. That is how long users have been stuck, and the head blocker is still where to start.downstream_waiterscpu_time_mslogical_readswritestotal_elapsed_time_mstempdb_allocations_kbtempdb_current_kbsession_idlogin_namehost_nameprogram_namedatabase_nameprogram_name usually names the application or the job behind the head blocker, which is the fastest route to whoever can commit or cancel it.sql_textHow to Fix Blocking Chains
Identify the head blocker (chain_level = 0) and investigate why its transaction is still open, application code that didn’t commit, a long-running batch, a session left open interactively. If it’s safe to do so:
-- Check what a session is doing before killing it
SELECT session_id, status, open_transaction_count, last_request_start_time
FROM sys.dm_exec_sessions WHERE session_id = 77;

-- Kill the head blocker only after confirming it's safe to lose that transaction
KILL 77;
Killing a mid-chain or leaf session almost never helps; the actual lock is held further up the chain regardless of what happens downstream.
Best Practices
- Always identify and act on the head blocker, not the session that happens to be visible in a user complaint.
- Keep transactions short and avoid leaving one open across user interaction, network calls, or application logic that isn’t strictly part of the database work.
- A recurring pattern of the same query becoming a head blocker points at a design issue (missing index causing a wider lock footprint, a transaction scope that’s too large) worth fixing at the source.
MS Docs: sys.dm_exec_requests · sys.dm_exec_sessions · sys.dm_exec_connections
Frequently Asked Questions
Is the session at the top of a chain always the one to kill?
Almost always the one to investigate, not necessarily to kill outright. Confirm what it’s doing and whether its transaction is safe to lose before terminating it; sometimes the better fix is letting it finish or committing it manually.
Why does this return more useful detail than sp_who2 or Activity Monitor?
Those tools show blocking pairs (who’s blocking whom, one level), not full chains, and they don’t reliably surface an idle head blocker’s last statement. This script walks the full chain and recovers that context in one pass.
Summary
A blocked session is a symptom; the head blocker several levels up the chain is the actual cause. This script exists to collapse that investigation from several manual steps into one query.
Run this script the moment blocking is suspected, since the chain only exists while the blocking is actively happening; there’s nothing to capture once it clears. If you are not sure blocking is the cause, SQL Server Is Slow: What to Check First, in Order shows how to rule it in or out first.
Related
You may also find these useful:
- DBA Scripts: Blocking and Locking
- Get Lock Escalation, Contention Analysis, and Blocking Chains with Plan
- Get Blocking Summary
- Get Deadlock Summary
- Log and Filter sp_who2 Results in SQL Server
- Get Open Transactions
- Troubleshoot SQL Server Blocking, Step by Step
- DBA Scripts: The Complete Guide, the map across every script on this site
Leave a Reply