
LCK_M_* wait is a session stuck behind a lock another session holds, and one open transaction is usually behind the whole pile-up. Find the head of the blocking chain before you kill anything: Step 1 shows how.The suffix names the lock the waiting session asked for. LCK_M_X is exclusive, taken to write a row. LCK_M_S is shared, taken to read one under READ COMMITTED. LCK_M_U is update, taken while an UPDATE finds its rows and converted to exclusive before it writes. High totals for any of them mean blocking is regular, not a one-off.
Is This Wait Expected?
Small amounts of locking are inherent in transactional systems. Under READ COMMITTED (the default), shared locks are held briefly and released as rows are read, so this generates almost no LCK_M_S. LCK_M_X appears when writers compete for the same rows.
It is a problem when:
LCK_M_XorLCK_M_Sis in your top 3 wait typesavg_wait_msis in the seconds, not milliseconds- Users are reporting timeouts or sluggish response during peak hours
- You see connection pooling saturation, queries piling up waiting for locks
When To Ignore It
Short, infrequent lock waits, a small amount of LCK_M_X from occasional row-level conflicts is normal. Look at avg_wait_ms: if the average wait is under 10 ms, it is not causing pain.
Batch maintenance windows, large UPDATE or DELETE operations will cause temporary locking. Expected if it is contained to a known maintenance window.
What LCK_M_X vs LCK_M_S Tells You
LCK_M_X dominant, writers are blocking other writers. 2 sessions are trying to modify the same rows simultaneously. This happens with hot rows, a single row that many sessions update (counters, queues, order IDs).
LCK_M_S dominant, writers are blocking readers. Under READ COMMITTED (without RCSI), a reader takes a shared lock that conflicts with a writer’s exclusive lock. This is the most common blocking pattern. The fix is usually enabling Read Committed Snapshot Isolation (RCSI).
LCK_M_U dominant, update contention. Multiple sessions are running UPDATEs that read-then-modify the same row range. U locks prevent the “lost update” pattern where 2 sessions read the same value, modify it, and write conflicting results.
Root Causes
5 causes, and they need different fixes: the first 3 are about how long a lock is held or how wide it is, the last 2 are about a decision made in the application. Find the head of the chain first, then work out which of these it is.
A transaction begins, takes its locks, and then does something slow while still holding them: a network call, a long calculation, another query, or worst of all a wait for a human. Everything that needs those rows queues behind it.
The head of the blocking chain is sleeping with open_transaction_count above 0 in sys.dm_exec_sessions. A blocker with no running request is the signature: it is not working, it is holding. Get Open Transactions finds it directly.
A query that should seek to a handful of rows scans a range instead, and takes a lock on every row it touches on the way. The index is not just a speed problem here: it decides how much of the table gets locked.
The blocked and blocking statements show scans in their plans, and sys.dm_tran_locks has a large row count against one object for a query you expected to touch very little.
SQL Server starts with row locks and escalates to a table lock once a single statement holds too many on one object, roughly 5,000. After escalation a query that logically touched a few thousand rows is blocking the entire table.
The blocker holds an OBJECT lock in sys.dm_tran_locks where you expected KEY or RID entries. That switch from many small locks to one big one is escalation, and it is visible nowhere else.
SERIALIZABLE and REPEATABLE READ hold their shared locks until the transaction ends rather than releasing them after the read. A report that only needed a consistent snapshot can block writers for its whole duration.
transaction_isolation_level in sys.dm_exec_sessions reads 4 for SERIALIZABLE or 3 for REPEATABLE READ on the blocker. Most OLTP work should be sitting at 2, READ COMMITTED.
One row updated by many sessions at once: a counter, a queue table, a sequence generator built from a table. Every session is correct, the design is the problem, and no index will help.
Many blocked sessions share the same resource_description in sys.dm_tran_locks. One row identifier appearing over and over is the tell that separates this from ordinary blocking.
How To Diagnose It
Use the blocking scripts from this repo to investigate live:
# Quick summary - is blocking happening, who is the head blocker?
.\run.ps1 Get-BlockingSummary

# Full chain - every blocked session and what's blocking them
.\run.ps1 Get-BlockingSessions
Identify the head blocker manually:
SELECT
    r.session_id,
    r.blocking_session_id,
    r.wait_type,
    r.wait_time / 1000.0            AS wait_sec,
    r.wait_resource,
    DB_NAME(r.database_id)          AS database_name,
    SUBSTRING(t.text, (r.statement_start_offset / 2) + 1,
        ((CASE r.statement_end_offset WHEN -1 THEN DATALENGTH(t.text)
          ELSE r.statement_end_offset END - r.statement_start_offset) / 2) + 1) AS blocked_statement
FROM sys.dm_exec_requests r
CROSS APPLY sys.dm_exec_sql_text(r.sql_handle) t
WHERE r.blocking_session_id > 0
ORDER BY r.wait_time DESC;
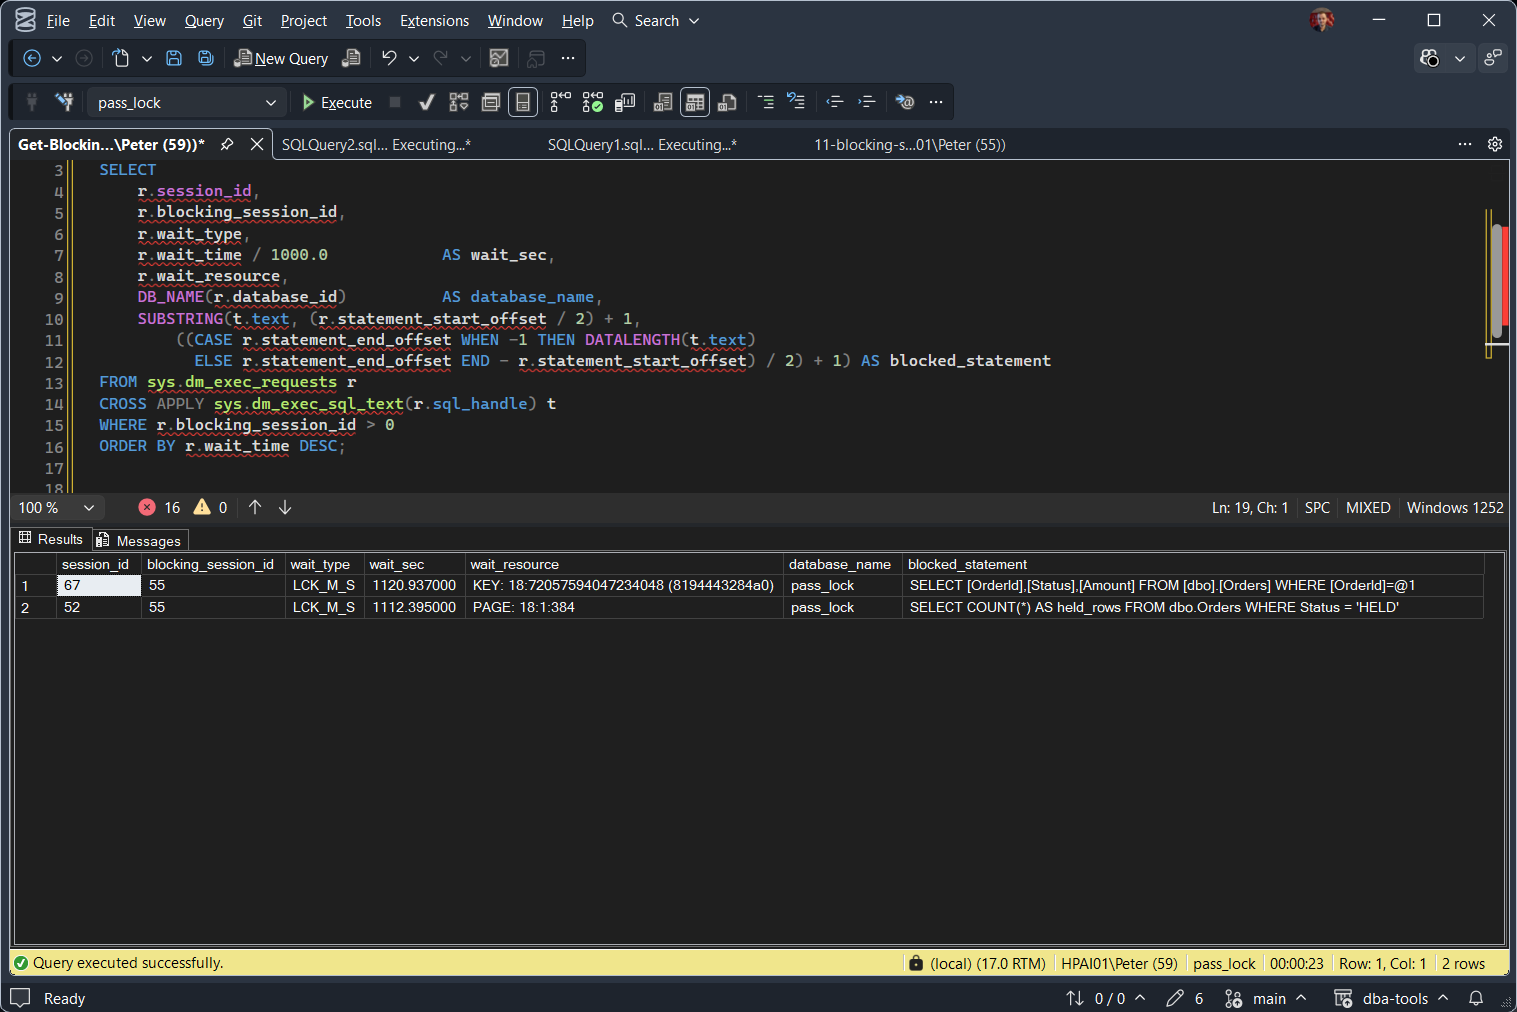
Both blocked sessions point at session 55, and 55 is not in the list: it is not waiting on anything. That is the head blocker. Sessions with blocking_session_id = 0 but with other sessions waiting on them are the head blockers. Look at what it is doing: is it idle in an open transaction?
Check for open idle transactions:
SELECT
    s.session_id,
    s.status,
    s.open_transaction_count,
    s.last_request_start_time,
    s.last_request_end_time,
    s.program_name,
    s.host_name
FROM sys.dm_exec_sessions s
WHERE s.open_transaction_count > 0
  AND s.status = 'sleeping'
ORDER BY s.last_request_end_time;
A sleeping session with an open transaction is the classic head blocker. The application opened a transaction, ran a query, and then paused (user think time, application processing) without committing.
What To Do
In order. The first step is diagnosis and the rest are fixes, narrowing from the transaction down to the pattern behind it.
Step 1: Find the Head of the Chain
Everything else is guesswork until you know which session is holding the lock everyone else is waiting for. Killing it buys time and fixes nothing, so capture what it was doing first: program_name and host_name tell you which application, and the open transaction tells you the pattern.
Troubleshoot SQL Server Blocking, Step by Step is the long version of this step, and Get-BlockingChains walks the chain recursively rather than showing you one pair.
Step 2: Shorten the Transaction
This is the fix for the most common cause, and it is an application change rather than a server setting. Move everything that does not need to be inside the transaction outside it: no external calls, no expensive calculation, and never a wait for user input between BEGIN TRAN and COMMIT.
Step 3: Let Readers Stop Taking Shared Locks
For LCK_M_S, a reader blocked by a writer, Read Committed Snapshot Isolation removes most of the conflict outright. Readers stop taking shared locks and read from the version store instead.
ALTER DATABASE [YourDatabase] SET READ_COMMITTED_SNAPSHOT ON;
No application change and no compatibility level requirement, but it moves the cost to tempdb, which now carries the version store. Isolation Levels and RCSI covers what else changes.
Step 4: Narrow the Lock With an Index
Adding the missing index cuts both the duration and the width of the lock: the query finishes sooner, and it locks the rows it needed rather than every row it scanned on the way. This is also what keeps a statement under the escalation threshold in the first place.
Get Missing Indexes names the candidates.
Step 5: Fix the Pattern, Not the Symptom
2 of the causes above are design decisions, and they are the ones no setting will fix.
For a hot row: use IDENTITY or a sequence instead of a counter table, and let queue readers skip locked rows with READPAST rather than queue behind them. For an isolation level stronger than the work needs, check whether SERIALIZABLE was a decision or a default that nobody revisited; most OLTP workloads are correct on READ COMMITTED.
Related Scripts
- Get-WaitStatistics, the overview script
- Get-BlockingSummary / Get-BlockingSessions, quick triage when blocking is happening or the full chain with blocked statements
- Get-BlockingChains, every blocking chain from the head blocker down, including a sleeping head blocker still holding locks
- Get-OpenTransactions, the sleeping transaction behind most of these waits
- Troubleshoot SQL Server Blocking, Step by Step, the full walkthrough when this wait is at the top
- Isolation Levels and RCSI, what changes when readers stop taking shared locks
- Lock Request Time Out Period Exceeded (Error 1222), the error a caller sees when it stops waiting
Leave a Reply