
Understanding Transaction Log Size Usage
Keeping an eye on transaction log usage is one of the simplest ways to prevent unexpected database outages. When a transaction log fills, SQL Server cannot continue writing transactions, backups begin failing, applications stop processing writes, and production quickly turns into an incident.
Many environments monitor overall disk capacity but don’t monitor how much of each transaction log is actually being used. A 500 GB log file isn’t necessarily a problem if only 20 GB is in use, while a 20 GB log file that’s 99% full could stop an application within minutes.
This script provides a quick overview of every user database, showing the total log size, how much space is currently used, how much remains free, and the percentage of the transaction log currently in use. It gives DBAs an immediate health check without needing to inspect each database individually.
Why Transaction Log Size and Usage Matters
Transaction logs are vital for database recovery and point-in-time restore capabilities. However, if logs grow too large or are not managed properly, they can cause several operational issues:
- Disk space exhaustion leading to database downtime
- Increased backup and restore times
- Slower overall database performance
- Difficulties in managing database growth and capacity planning
Understanding the size, usage, autogrowth settings, and last backup times of transaction logs enables DBAs to maintain a healthy, efficient environment and avoid critical failures.
Every modification made to a SQL Server database is first written to the transaction log. SQL Server relies on the transaction log for:
- Transaction rollback
- Crash recovery
- Point-in-time restores
- Log shipping
- Always On Availability Groups
- Database mirroring
- Replication
- Change Data Capture (CDC)
As transactions are committed and log backups occur (for FULL or BULK_LOGGED recovery models), SQL Server marks portions of the log as reusable. The physical log file does not automatically shrink; it reuses available space inside the existing file.
Common Symptoms
- Frequent autogrowth events in the transaction log
- Log files occupying a significant portion of disk space unexpectedly
- Slow database recovery or backup times
- Errors related to insufficient disk space during transaction log operations
- Transaction log backups failing due to insufficient disk space
- Transaction log full errors (9002)
- Failed INSERT, UPDATE, or DELETE operations
- Log backups becoming unusually large
- Always On secondary replica lag
- Long running transactions preventing log truncation
When to Run This Script
- During routine health checks of SQL Server instances
- After large transaction volumes or significant database activity
- When experiencing disk space issues or log growth anomalies
- Before scheduled maintenance windows to assess current log sizes
- Following log backup failures or delays
The Script
Run the following script against your SQL Server instance to get detailed insights into transaction log sizes and usage:
- Tested on: SQL Server 2025 (RTM CU8), Windows lab instance
- Last verified: 2026-08-30 (saved output from a real run, Get-TransactionLogSizeAndUsage-20260830-215940.csv)
- Permissions: VIEW SERVER STATE (DBCC SQLPERF), read on msdb.dbo.backupset
- Safety: read-only, impact low
Any thresholds in this script are operational heuristics; claim types are labelled where they appear in the text.
/*
Script Name : Get-TransactionLogSizeAndUsage
Category    : storage-capacity-management
Purpose     : Show transaction log size, used space, free space, and percent used per database.
Author      : Peter Whyte (https://sqldba.blog/dba-scripts-get-transaction-log-size-and-usage/)
Requires    : VIEW SERVER STATE (DBCC SQLPERF), read on msdb.dbo.backupset
Notes       : Usage figures come from DBCC SQLPERF(LOGSPACE), which reports every database.
              FILEPROPERTY is current-database-scoped and silently returned 0 for all other
              databases (fixed 2026-07-19). Offline databases show NULL usage.
HealthCheck : Yes
*/
-- SAFE:ReadOnly
-- IMPACT:Low
SET NOCOUNT ON;

DECLARE @logspace TABLE
(
    database_name sysname NOT NULL PRIMARY KEY,
    log_size_mb FLOAT NOT NULL,
    log_space_used_pct FLOAT NOT NULL,
    status INT NOT NULL
);

INSERT INTO @logspace (database_name, log_size_mb, log_space_used_pct, status)
EXEC ('DBCC SQLPERF(LOGSPACE) WITH NO_INFOMSGS');

;WITH LogBackup AS
(
    SELECT
        database_name,
        MAX(backup_finish_date) AS last_log_backup
    FROM msdb.dbo.backupset
    /* Copy-only log backups excluded: this date is read as "when did the log last truncate",
       and a copy-only log backup does not truncate it. */
    WHERE type = 'L'
      AND is_copy_only = 0
    GROUP BY database_name
)

SELECT
    d.name AS database_name,

    d.state_desc,

    d.recovery_model_desc,

    d.log_reuse_wait_desc,

    COUNT(mf.file_id) AS log_file_count,

    STRING_AGG(mf.physical_name, '; ') AS log_file_paths,

    CAST(
        SUM(CAST(mf.size AS BIGINT)) * 8.0 / 1024
        AS DECIMAL(18,1)
    ) AS log_size_mb,

    CAST(
        MAX(ls.log_size_mb) * MAX(ls.log_space_used_pct) / 100.0
        AS DECIMAL(18,1)
    ) AS log_used_mb,

    CAST(
        MAX(ls.log_size_mb) * (100.0 - MAX(ls.log_space_used_pct)) / 100.0
        AS DECIMAL(18,1)
    ) AS log_free_mb,

    CAST(
        MAX(ls.log_space_used_pct)
        AS DECIMAL(5,1)
    ) AS log_used_pct,

    CASE
        WHEN COUNT(DISTINCT mf.is_percent_growth) > 1
            THEN 'Mixed'

        WHEN MAX(CAST(mf.is_percent_growth AS INT)) = 1
            THEN CAST(MAX(mf.growth) AS VARCHAR(20)) + '%'

        ELSE
            CAST(
                (MAX(CAST(mf.growth AS BIGINT)) * 8) / 1024
                AS VARCHAR(20)
            ) + ' MB'
    END AS autogrowth_setting,

    CASE
        WHEN COUNT(DISTINCT mf.is_percent_growth) > 1
            THEN 'Mixed'

        WHEN MAX(CAST(mf.is_percent_growth AS INT)) = 1
            THEN 'Percent'

        ELSE
            'Fixed MB'
    END AS autogrowth_type,

    CASE
        WHEN MAX(mf.max_size) = -1
            THEN 'Unlimited'

        ELSE
            CAST(
                (MAX(CAST(mf.max_size AS BIGINT)) * 8) / 1024
                AS VARCHAR(20)
            ) + ' MB'
    END AS max_size,

    lb.last_log_backup,

    CASE
        WHEN lb.last_log_backup IS NULL
            THEN NULL

        ELSE
            DATEDIFF(
                MINUTE,
                lb.last_log_backup,
                GETDATE()
            )
    END AS minutes_since_last_log_backup
FROM sys.master_files AS mf
JOIN sys.databases AS d
    ON mf.database_id = d.database_id
LEFT JOIN @logspace AS ls
    ON ls.database_name = d.name
LEFT JOIN LogBackup AS lb
    ON d.name = lb.database_name
WHERE mf.type_desc = 'LOG'
AND d.database_id > 4
GROUP BY
    d.name,
    d.state_desc,
    d.recovery_model_desc,
    d.log_reuse_wait_desc,
    lb.last_log_backup
ORDER BY
    log_used_pct DESC,
    log_size_mb DESC;
How To Run From The Repo
Clone the DBA Tools repository, initialize your environment, and execute the script:
# Clone dba-tools repo:
git clone https://github.com/peterwhyte-lgtm/dba-tools

# Initialize environment:
cd dba-tools
.\Initialize-Environment.ps1

# Run the transaction log size and usage check:
.\run.ps1 Get-TransactionLogSizeAndUsage

# To run against a remote SQL Server instance:
.\run.ps1 Get-TransactionLogSizeAndUsage -ServerInstance SQLSERVER01
This will execute the script and generate a detailed report on your transaction logs, helping you stay on top of disk space and log management.
Example Output
Run against a lab instance.
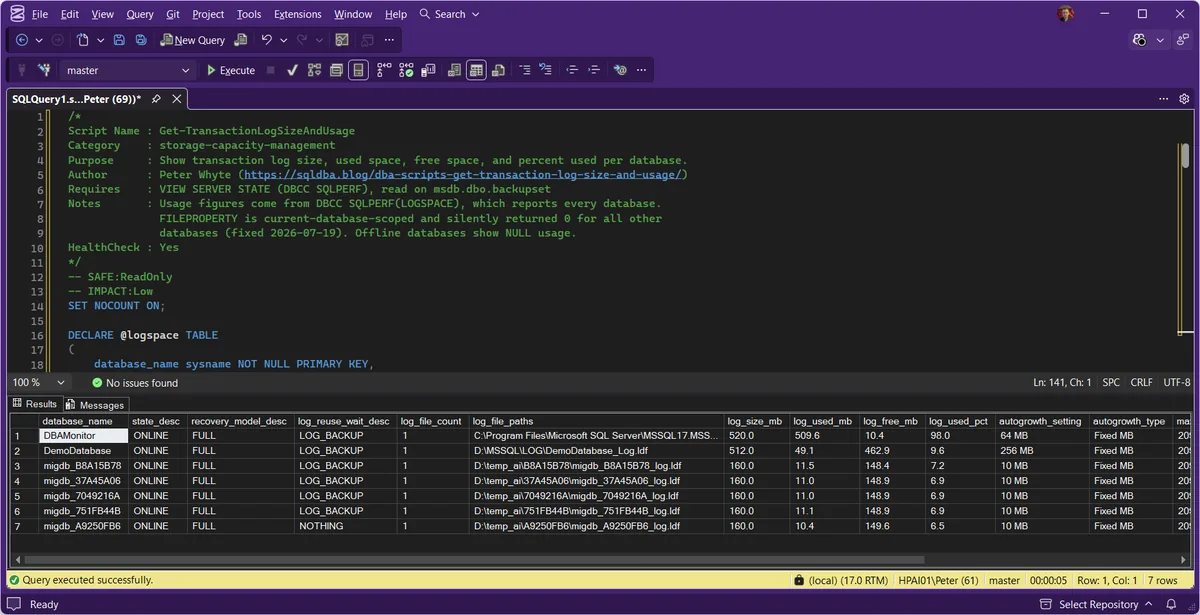
The top row is the finding. Its log is 98 percent full and log_reuse_wait_desc reads LOG_BACKUP, so the space is held by records waiting for a log backup that is not running. The rows below it sit under 10 percent, which is what a working log backup schedule looks like, and one reads NOTHING — nothing is holding its log space at all.
Understanding the Results
One row per user database. Read log_used_pct first, then the reason in log_reuse_wait_desc, then whether a log backup has run recently enough to release the space that reason is holding.
database_namestate_descrecovery_model_desclog_reuse_wait_descNOTHING and CHECKPOINT are the healthy steady states. LOG_BACKUP, ACTIVE_TRANSACTION, AVAILABILITY_REPLICA and REPLICATION each name a different cause and a different fix, which is what Log Reuse Waits covers in full.log_size_mblog_used_mblog_free_mbDBCC SQLPERF(LOGSPACE) while the size comes from sys.master_files, so the two can disagree by a fraction of a megabyte — do not try to reconcile the three columns exactly. A log backup frees space inside the file, it does not make the file smaller.log_used_pctlog_file_countlog_file_pathsautogrowth_settingautogrowth_typeMixed means the log files on this database disagree with each other.Act when the type is Percent. A percentage of a large log is an unpredictable growth, and the health check reviewer flags it on any file.max_sizeUnlimited. A value of 2097152 MB is the 2 TB default a log file inherits rather than a limit anybody chose.last_log_backupminutes_since_last_log_backupmsdb only, so on an availability group replica that does not take the backups itself the column is empty even while the primary is backing up on schedule. Copy-only log backups are excluded here, because a copy-only log backup preserves the archive point without releasing any space.Act when both are blank on a FULL or BULK_LOGGED database. Blank is not a small number, it means no log backup has ever released space in this log, and it sorts as nothing rather than to the top of the report.Regularly review these metrics to ensure logs are managed efficiently, preventing disk space issues and maintaining database performance.
Common Causes
- Infrequent log backups leading to unbounded log growth
- Long-running transactions preventing log truncation
- Misconfigured autogrowth settings (too small or percent-based on large files)
- Large transaction volumes or bulk operations
- Replication backlog or CDC processing delays
- Insufficient disk space for log files
How to Fix Problems
The correct fix depends on why the log cannot be reused.
Common actions include:
- Schedule regular log backups (especially in FULL recovery model) to truncate inactive portions
- Adjust autogrowth settings based on workload and database growth patterns. Avoid very small increments and percentage based growth on large transaction logs
- Monitor and optimize or kill long-running transactions
- Allow replication or Always On replicas to catch up
- Consider switching to SIMPLE recovery model for non-critical databases (if point-in-time recovery is not required)
- Increase disk capacity or move log files to larger drives if necessary
Best Practices
- Automate regular log backups and maintenance tasks
- Monitor log size trends over time (consider pairing with growth history scripts)
- Set autogrowth increments to balance between frequent autogrowth events and disk space usage
- Regularly review database recovery models and autogrowth settings
- Document and review log management policies
- Alert on logs > 80% full or backups older than X hours
- Trend transaction log utilisation over time rather than relying on a single reading
Microsoft’s reference covers DBCC SQLPERF, sys.master_files and sys.databases in full.
Related Scripts
- Storage and Capacity (hub)
- Autogrowth History
- Database Files Detail
- Database Free Space Summary
- Database Growth Risk and Forecast
- Database Sizes and Free Space
- Disk Space
- Filegroup Space
- VLF Counts
- DBA Scripts: The Complete Guide, the map across every script on this site
FAQs
What is Transaction Log Size and Usage?
It indicates how much space the transaction log occupies, how much is used, free space, and the percentage used, helping DBAs monitor log health and growth.
How often should I check transaction log sizes?
As part of regular maintenance, daily for critical systems, weekly for others, especially after heavy transactions or if disk space becomes constrained.
Why does my log show 100% used even after a backup?
Those are two different columns, and the difference is the whole answer. A log backup frees space inside the file; it does not make the file smaller, so log_size_mb stays exactly where it was. What should move is log_used_pct — a backup that truncates successfully drops it.
So if the percentage is still near 100 after a log backup, truncation did not happen, and the reason is sitting in log_reuse_wait_desc: an open transaction, an availability replica that has not caught up, replication that has not read the log yet. Read that column next. DBCC SHRINKFILE is the wrong reach here — it cannot free space that something is still holding, and on a log that is genuinely full it does nothing at all.
Summary
Effective management of transaction logs is vital for maintaining SQL Server health and performance. Regularly monitoring log sizes, usage, and backup status helps prevent unexpected disk space issues and ensures smooth recovery operations. Incorporate this script into your routine health checks to stay ahead of potential storage problems and optimize your database environment for stability and growth.
Leave a Reply