
When users report the application is slow, the first question is always the same: what is actually running right now? Not what ran an hour ago, not what the plan cache thinks is expensive on average, but what is executing on the instance at this moment and how long it has been at it.
This script answers that question in one result set. It returns every currently executing request ordered by elapsed time, with the CPU, I/O, wait and blocking details you need to decide whether you are looking at a genuinely heavy query, a blocked session, or something that should have finished hours ago.
Why Long Running Queries Matter
A query that runs for minutes when it should take seconds is rarely just slow in isolation. It holds locks that block other sessions, it ties up a worker thread, it keeps the transaction log active, and if it is part of a chain the pain spreads to sessions that have nothing to do with it.
The elapsed-time view is the fastest way to separate cause from symptom during an incident. The session at the top of the list with a high elapsed time and no blocker is usually the problem; the twenty sessions below it with a blocking_session_id pointing at it are just the victims.
When to Run This Script
- Routine SQL Server health checks
- Live incidents, when users report slowness or timeouts
- When CPU, I/O or memory pressure appears without an obvious cause
- Before restarting a service or failing over, to see what would be interrupted
- When a scheduled job or batch process has overrun its window
The Script
Run the following script against your SQL Server instance.
/*
Script Name : Get-LongRunningQueries
Category    : performance-troubleshooting
Purpose     : Active requests with elapsed and wait details — ordered by elapsed time descending.
Author      : Peter Whyte (https://sqldba.blog/dba-scripts-get-long-running-queries/)
Requires    : VIEW SERVER STATE
*/
-- SAFE:ReadOnly
-- IMPACT:Low
SET NOCOUNT ON;

SELECT
    r.session_id,
    s.host_name,
    s.program_name,
    s.login_name,
    DB_NAME(r.database_id) AS database_name,
    r.status,
    r.command,
    r.cpu_time AS cpu_time_ms,
    r.total_elapsed_time / 1000.0 AS elapsed_time_seconds,
    r.reads,
    r.writes,
    r.logical_reads,
    r.wait_type,
    r.wait_time / 1000.0 AS wait_time_seconds,
    r.blocking_session_id,
    SUBSTRING(
        st.text,
        (r.statement_start_offset / 2) + 1,
        ((CASE r.statement_end_offset
              WHEN -1 THEN DATALENGTH(st.text)
              ELSE r.statement_end_offset
          END - r.statement_start_offset) / 2) + 1
    ) AS statement_text
FROM sys.dm_exec_requests r
INNER JOIN sys.dm_exec_sessions s
    ON r.session_id = s.session_id
CROSS APPLY sys.dm_exec_sql_text(r.sql_handle) st
WHERE r.session_id <> @@SPID
ORDER BY r.total_elapsed_time DESC;
It joins the active-request and session DMVs, extracts the exact statement each request is executing, and returns the lot ordered by elapsed time so the longest runner is always row one.
How To Run From The Repo
Clone DBA Tools, initialize and run the script:
# Clone dba-tools repo:
git clone https://github.com/peterwhyte-lgtm/dba-tools

# Initialize environment:
cd dba-tools
.\Initialize-Environment.ps1

# Show active queries ordered by elapsed time:
.\run.ps1 Get-LongRunningQueries

# To run against a remote sql server:
.\run.ps1 Get-LongRunningQueries -ServerInstance SQLSERVER01
This script lives in the repo at:
sql/performance/active-sessions/Get-LongRunningQueries.sqlpowershell/wrappers/performance/active-sessions/Get-LongRunningQueries.ps1
Example Output
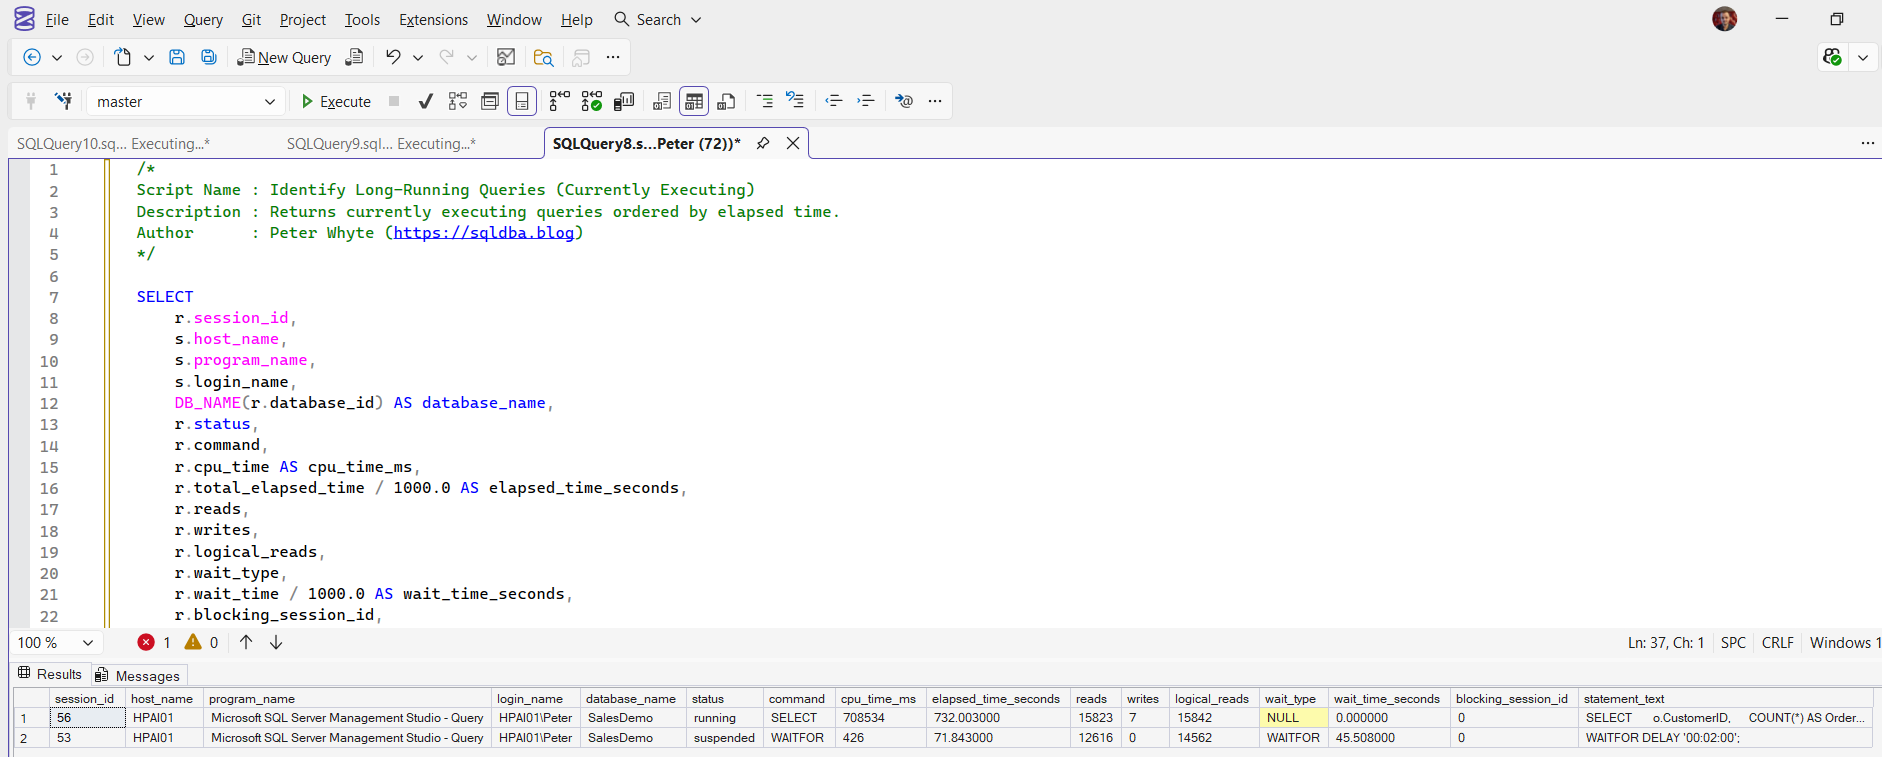
The result set shows currently executing sessions ordered by elapsed time, including who is running them and from where, CPU and I/O consumed so far, the current wait, any blocking relationship, and the statement text itself.
Understanding the Results
session_idhost_nameprogram_namelogin_namedatabase_nameprogram_name with a huge elapsed time is very often an ad hoc query someone forgot about, and session_id is what you pass to KILL if it comes to that.Act when the program is SQLAgent. A job step that has run for an hour is a job problem, not a query problem, and killing it only makes it run again on the next schedule.statuscommandrunning means it is on a CPU right now, suspended means it is waiting for something, runnable means it is queued for a CPU. command is the statement type: SELECT, INSERT, BACKUP DATABASE, DBCC.Act when status is runnable across several sessions. That is CPU pressure, not slow queries, and the wait type will say SOS_SCHEDULER_YIELD.cpu_time_mselapsed_time_secondsreadswriteslogical_readswait_typewait_time_secondsblocking_session_idsys.dm_exec_sessions.statement_textHow to Respond to a Long Running Query
- Follow the blocking chain first. If the top rows all point at one
blocking_session_id, that head blocker is the real issue. Deal with it and the rest usually clears on its own. - Check the wait type. A runner stuck on
LCK_M_*waits is blocked,PAGEIOLATCH_*points at storage,CXPACKET/CXCONSUMERat parallelism. The wait tells you which subsystem to look at next. - Look at the statement text before acting. A long elapsed time on an index rebuild or a backup is expected behaviour, not a problem to fix.
- Kill only as a last resort.
KILL <session_id>works, but remember the rollback can take as long as the work already done, sometimes longer. For a session hours into a large modification, killing it can extend the outage rather than end it.
Microsoft’s reference covers sys.dm_exec_requests, sys.dm_exec_sessions and sys.dm_exec_sql_text in full.
Related Scripts
You may also find these scripts useful:
- Query and Performance Tuning (hub)
- Active Requests
- Active Requests with Plan
- Active Sessions
- Worker Threads and Active Sessions
- SQL Server High CPU, the symptom router: start here when CPU is pinned
- DBA Scripts: The Complete Guide, the map across every script on this site
Frequently Asked Questions
How do I find queries that already finished?
This script only shows currently executing requests. For completed queries, look at Query Store or the plan cache: the top CPU and top I/O query scripts in the repo cover that angle.
Is this safe to run on a busy production server?
Yes. It reads DMVs only, takes no locks on user tables, and excludes its own session from the results. It is marked SAFE:ReadOnly in the repo header.
When should I kill a long running session?
When it is blocking others, is not doing legitimate long work like a rebuild or backup, and the owner confirms it can go. Always check how much work would need rolling back first, because the rollback is single-threaded and can outlast the original query.
Summary
Long running queries are the front line of most performance incidents, and this script is the fastest honest answer to “what is running right now”. Elapsed time sorts the suspects, the wait and blocking columns separate causes from victims, and the statement text stops you guessing.
It earns a place in the routine health check too. Run it on a quiet day and you learn what normal looks like, which is exactly what makes the abnormal obvious at 2am.
Leave a Reply