
Group the Error Log Instead of Scrolling It
The SQL Server error log is where the instance tells you what’s wrong, but on a busy server it’s also where hundreds of routine startup, backup, and checkpoint messages bury the handful of lines that actually matter. Scrolling xp_readerrorlog output looking for the one memory-pressure warning or the one login failure among pages of noise is slow, and it’s easy to miss something on a bad day when there’s more log than usual.
Get-ErrorLogPatterns reads the current error log and groups every entry into one of nine categories (memory pressure, login failure, backup/restore, IO issue, corruption/integrity, database state, auto-growth, deadlock, or generic error/warning) with a count, a first/last-seen timestamp, and one sample message per category. It turns “read the whole log” into “scan nine rows.”
Why Error Log Patterns Matters
- Volume hides signal. A single genuine memory-pressure warning is easy to miss in a log full of routine backup-completion and checkpoint lines. Categorized counts surface it immediately.
- First-seen and last-seen timestamps show duration, not just occurrence. A memory pressure category spanning several hours is a different problem than one that appeared once and stopped.
- It’s a fast first move during an incident. Before diving into DMVs, a categorized error log pass tells you whether the instance itself has been reporting a problem, and for how long.
- The categorization is keyword-based, not perfect, and that matters for how you read the results (more on this below).
When to Run This Script
- As part of a daily or weekly health pass, alongside Get Recent Error Log Entries
- First, during an active incident, to get an instant read on whether the instance has been logging anything relevant in the recent window
- After a bad night, to confirm whether an issue you’re chasing left a trail in the error log at all
- When investigating a specific category (memory, IO, corruption) to pull a fast baseline before digging into the matching DMVs
The Script
Run the following script against your SQL Server instance.
- Tested on: SQL Server 2025 (RTM CU8), Windows lab instance
- Last verified: 2026-08-30 (saved output from a real run, Get-ErrorLogPatterns-20260830-234340.csv)
- Permissions: EXECUTE on xp_readerrorlog, which is granted to sysadmin and securityadmin. VIEW SERVER STATE does not grant it.
- Safety: read-only, impact low
/*
Script Name : Get-ErrorLogPatterns
Category    : monitoring
Purpose     : Reads the current SQL Server error log and groups entries by category — surfaces memory pressure, login failures, IO issues, corruption warnings, and auto-growth events without scrolling through raw entries.
Author      : Peter Whyte (https://sqldba.blog/dba-scripts-get-error-log-patterns/)
Requires    : EXECUTE on xp_readerrorlog, which is granted to sysadmin and securityadmin.
              VIEW SERVER STATE does not grant it.
*/
-- SAFE:ReadOnly
-- IMPACT:Low
SET NOCOUNT ON;

/* ── How many hours back to read (default 24) ───────────────────────────── */
DECLARE @HoursBack INT = 24;
/* ─────────────────────────────────────────────────────────────────────────── */

IF OBJECT_ID('tempdb..#ErrLog') IS NOT NULL DROP TABLE #ErrLog;
CREATE TABLE #ErrLog (
    LogDate DATETIME NOT NULL,
    ProcessInfo NVARCHAR(50),
    Txt NVARCHAR(4000)
);

DECLARE @StartDate DATETIME = DATEADD(HOUR, -@HoursBack, GETDATE());
INSERT INTO #ErrLog
EXEC xp_readerrorlog 0, 1, NULL, NULL, @StartDate, NULL, N'desc';

/* Categorise once, in a CTE. The CASE used to be written out twice, in the SELECT and
   again in the GROUP BY, so any change to a pattern had to be made in both places or the
   two would silently disagree. */
WITH categorised AS (
    SELECT
        LogDate,
        Txt,
        CASE
            WHEN Txt LIKE '%paged out%'
              OR Txt LIKE '%virtual address space%'
              OR Txt LIKE '%out of memory%'
              OR Txt LIKE '%cannot allocate%' THEN 'Memory Pressure'
            WHEN Txt LIKE '%login failed%'
              OR Txt LIKE '%18456%'
              OR Txt LIKE '%password%incorrect%' THEN 'Login Failure'
            /* Corruption is tested BEFORE IO and Backup, and its patterns match the way the
               error log actually writes these lines. Verified 2026-08-30, and the category was
               inverted before that: 'Error: 823, Severity: 24' matched nothing at all and fell
               through to Error / Failure, the real 824 text ('logical consistency-based I/O
               error') matched IO Issue first and never reached here, and the ONLY thing landing
               in Corruption / Integrity was 'CHECKDB ... finished without errors', a success
               message. The bucket a DBA scans first for corruption could not detect corruption. */
            WHEN Txt LIKE '%corrupt%'
              OR Txt LIKE '%consistency-based I/O error%'
              OR Txt LIKE '%Error: 823%'
              OR Txt LIKE '%Error: 824%'
              OR Txt LIKE '%Error: 825%'
              OR Txt LIKE '% 823 %'
              OR Txt LIKE '% 824 %'
              OR Txt LIKE '% 825 %'
              OR Txt LIKE '%suspect_pages%'
              OR (Txt LIKE '%CHECKDB%'
                  AND Txt NOT LIKE '%without errors%'
                  AND Txt NOT LIKE '%0 allocation errors and 0 consistency errors%')
                 THEN 'Corruption / Integrity'
            /* A clean integrity check is good news and must not be filed as a failure. Both
               wordings are excluded above and caught here, because 'finished without errors'
               and 'found 0 allocation errors' both contain the word errors and would otherwise
               be swept up by the generic Error / Failure branch further down. */
            WHEN Txt LIKE '%without errors%'
              OR Txt LIKE '%0 allocation errors and 0 consistency errors%'
                 THEN 'Informational'
            WHEN Txt LIKE '%Backup%'
              OR Txt LIKE '%BACKUP%'
              OR Txt LIKE '%backup of database%'
              OR Txt LIKE '%RESTORE%' THEN 'Backup / Restore'
            WHEN Txt LIKE '%I/O%'
              OR Txt LIKE '%stall%'
              OR Txt LIKE '%stalled%'
              OR Txt LIKE '%disk%' THEN 'IO Issue'
            WHEN Txt LIKE '%suspect%'
              OR Txt LIKE '%offline%'
              OR Txt LIKE '%emergency%'
              OR Txt LIKE '%recovery%' THEN 'Database State'
            WHEN Txt LIKE '%autogrow%'
              OR Txt LIKE '%Auto-grow%'
              OR Txt LIKE '% grew %'
              OR Txt LIKE '%Autogrow%' THEN 'Auto-Growth'
            WHEN Txt LIKE '%deadlock%' THEN 'Deadlock'
            WHEN Txt LIKE '%Error%'
              OR Txt LIKE '%error%'
              OR Txt LIKE '%failed%' THEN 'Error / Failure'
            WHEN Txt LIKE '%Warning%'
              OR Txt LIKE '%warning%' THEN 'Warning'
            ELSE 'Informational'
        END AS category
    FROM #ErrLog
),
/* latest_message must be the most RECENT entry in the category. It used to be
   LEFT(MAX(Txt), 200), which is the alphabetically greatest text, not the newest one, and
   it sat next to last_seen where a reader would naturally read the two as the same event. */
ranked AS (
    SELECT
        category,
        LogDate,
        Txt,
        ROW_NUMBER() OVER (PARTITION BY category ORDER BY LogDate DESC, Txt) AS rn
    FROM categorised
)
SELECT
    category,
    COUNT(*)                                        AS occurrences,
    MIN(LogDate)                                    AS first_seen,
    MAX(LogDate)                                    AS last_seen,
    LEFT(MAX(CASE WHEN rn = 1 THEN Txt END), 200)   AS latest_message
FROM ranked
GROUP BY category
ORDER BY occurrences DESC;

DROP TABLE #ErrLog;
Reads the current error log via xp_readerrorlog for a configurable window (@HoursBack, default 24), buckets every entry into one of nine categories by keyword match, then returns count, first-seen, last-seen, and one sample message per category, ordered by occurrence count descending.
How To Run From The Repo
Clone DBA Tools, initialize and run the script:
# Clone dba-tools repo:
git clone https://github.com/peterwhyte-lgtm/dba-tools

# Initialize environment:
cd dba-tools
.\Initialize-Environment.ps1

# Categorized error log summary for the last 24 hours:
.\run.ps1 Get-ErrorLogPatterns

# To run against a remote sql server:
.\run.ps1 Get-ErrorLogPatterns -ServerInstance SQLSERVER01
This script lives in the repo at:
sql/monitoring/error-log/Get-ErrorLogPatterns.sqlpowershell/wrappers/monitoring/error-log/Get-ErrorLogPatterns.ps1
Example Output
Understanding the Results
Five columns, and category is the one to read with care.
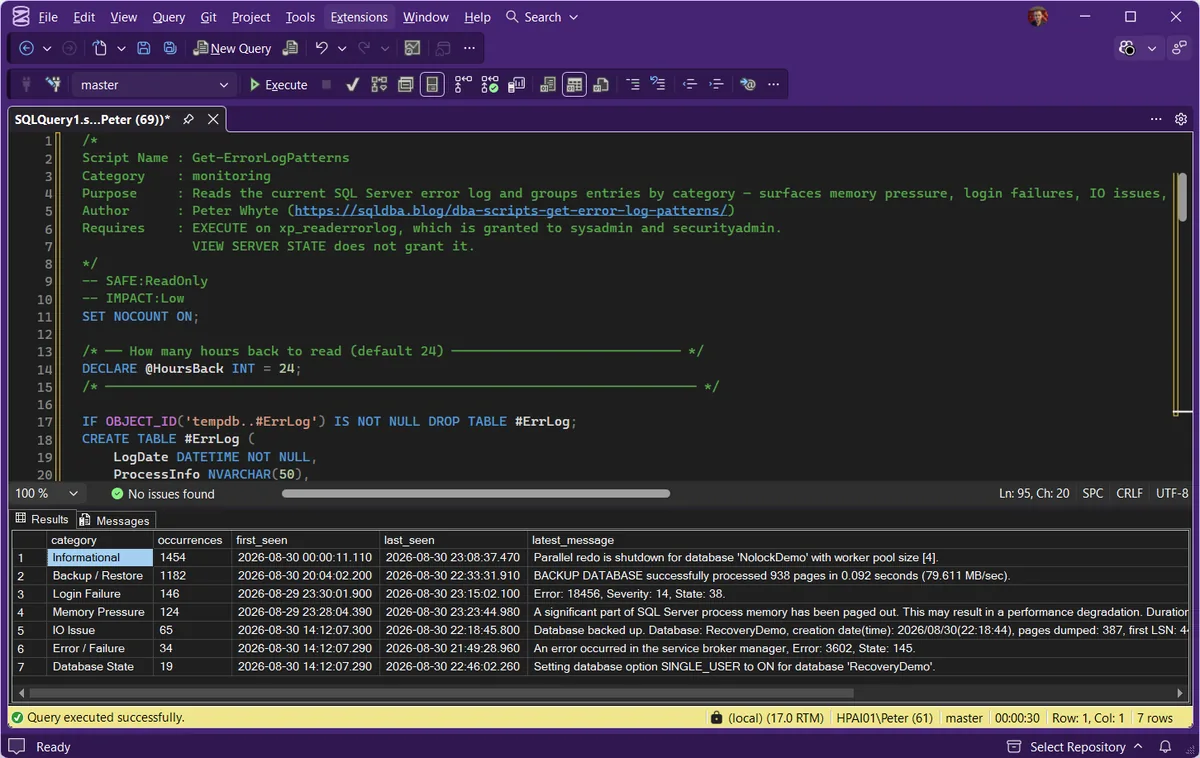
categoryoccurrencesfirst_seen and last_seenlatest_messagelast_seen and the two can be read together.The categories are matched on keywords in a fixed order, so an entry can land somewhere that reads worse than it is. In the output above, IO Issue is holding a routine “Database backed up” completion notice, and Database State is holding “Setting database option SINGLE_USER to ON”. Neither is a fault. That is exactly why latest_message is in the output: read it before reacting to a count.
Used this way the script is a triage pass rather than an alerting tool. It tells you which part of the log has earned your attention, and then you read that part properly with Get Recent Error Log Entries. It pairs with the silent failures audit, which covers the opposite problem: the things that go wrong without writing anything to the log at all.
Microsoft documents the error log itself, including how many are kept and how to read them outside SSMS, in Viewing the SQL Server error log.
Best Practices
- Read
latest_message, not just the count, before deciding a category needs action. Keyword matching means Corruption/Integrity and Database State both include benign entries alongside real ones. - Widen
@HoursBackwhen investigating an incident from the day before rather than assuming the default 24-hour window covers it. - Run this alongside Get Recent Error Log Entries rather than instead of it: this script tells you what categories exist and how often, that one gives you the raw entries in full.
Frequently Asked Questions
I asked for 24 hours and only got a handful of entries.
The read is against error log file 0, the current one, and nothing else. If the log was recycled inside your window, by sp_cycle_errorlog or an instance restart, everything before the recycle sits in an archive file this script never opens. Raising @HoursBack will not help, because those entries are in a file it is not reading.
A message is filed under a category I would not expect.
Categories are keyword matched and the first match wins, so an entry only ever lands in one bucket. A completion notice reading “Database backed up” does not contain the word backup, so it falls through to IO Issue instead of Backup / Restore. That is why latest_message is in the output: the category tells you where to look, the message tells you what you are looking at.
Can I trust a zero in Corruption / Integrity?
Within the window it reads, yes, and more than you could before. That branch is tested ahead of Backup and IO and it matches the forms the log actually writes, including Error: 823, Error: 824, Error: 825, the “logical consistency-based I/O error” text, suspect_pages, and a CHECKDB run that reported findings. A clean CHECKDB is filed as Informational so it cannot pad the count.
Why is a clean CHECKDB not counted as an error?
Because both of its wordings contain the word errors. “Finished without errors” and “found 0 allocation errors and 0 consistency errors” would otherwise be swept into Error / Failure by a keyword match, and a successful integrity check would inflate the very count you are scanning for trouble.
I get a permission error running it.
xp_readerrorlog is what gates this script, and it needs membership of securityadmin or sysadmin. VIEW SERVER STATE on its own is not enough, so a monitoring account that runs the rest of this toolkit happily can still fail here.
Related Scripts
You may also find these scripts useful:
- Recent Error Log Entries
- Schema Change History
- SQL Server Error Severities Explained
- DBA Scripts: The Complete Guide, the map across every script on this site
Summary
Get-ErrorLogPatterns won’t replace reading the full error log during a real incident, but it’s the fastest way to know whether that’s necessary in the first place. Nine categories, real counts, real timestamps, and one sample line each, scanned in the time it takes to read a short table rather than pages of raw log entries.
The one habit worth building alongside it: always check the sample message before treating a count as a verdict. The categorization is a keyword match, not true classification, and this post’s own real output shows exactly why that distinction matters.
Leave a Reply