
PAGEIOLATCH_SH appears when a query needs a data page that is not in the buffer pool, so SQL Server must read it from disk. The SH stands for shared latch, the read operation. The query waits until the I/O completes and the page is loaded into memory.
This is one of the most common waits on servers where the working data set does not fit in RAM.
Is This Wait Expected?
Some PAGEIOLATCH_SH is normal. Any server doing real work reads pages from disk occasionally. It becomes a signal worth investigating when:
- It is consistently in the top 3 wait types by
pct_total_wait pct_total_waitis above 20% and trending upwardavg_wait_msis above 5ms on a consistent basis (not just during batch jobs)- You are getting performance complaints and this is the top wait
Treat the numbers above as starting points, not limits. Baseline this wait on your own hardware during a normal week; the thresholds worth acting on are the ones your workload proves.
When To Ignore It
After a restart, the buffer pool is empty. Everything is a cold read for the first hour or two. PAGEIOLATCH_SH will be high and then settle down. Normal.
Nightly index rebuilds, rebuilding an index evicts pages from cache and reads them back. Expect a spike during the maintenance window.
Reporting and ETL queries, a query doing a full table scan on a large table will always generate PAGEIOLATCH_SH. This may be expected for that workload. Compare: is PAGEIOLATCH_SH high only during batch windows, or all the time?
Cold-cache first run, a query that has just been compiled runs its pages for the first time. The second run will not wait at all. Not a problem.
Root Causes
Four causes, and the order matters: the free one is third on the list, so rule it out before anyone signs off on hardware. The first two look identical in the wait statistics and are told apart by one column.
The data the server actually uses is bigger than the memory it is allowed to cache, so pages are read from disk over and over. More RAM is the obvious answer and often the right one, but read the diagnosis first: a missing index can make a correctly sized buffer pool look too small.
Read counts are high while avg_read_ms stays low. Fast reads happening constantly is churn, not a storage problem, and it points at memory or at the query that keeps evicting pages.
A read that does reach disk takes as long as the disk takes. A spinning disk, an overloaded SAN or a shared iSCSI path will make even a well-sized buffer pool feel broken, because the misses that remain are expensive.
avg_read_ms above 20 ms consistently, per file, in sys.dm_io_virtual_file_stats. Per file matters: one slow volume among several is the common shape, and an instance-wide average hides it.
Without the right index a query reads thousands of pages instead of a handful. That is more I/O than the work needs, and it cycles the buffer pool faster than well-indexed reads do, so it creates both of the causes above at once.
High logical reads on the top queries, and a plan showing a scan where a seek was possible. This is the cause to rule out before buying either RAM or storage, because it is the only one that is free to fix.
Plenty of RAM and still not enough, because columnstore scans, ETL, OLTP traffic and reporting each want a different set of pages cached. Every workload is reasonable on its own and they evict each other.
Churn that moves with the schedule rather than with a query: the wait climbs when the ETL or the reporting window starts and settles afterwards. One query is never the culprit for long.
How To Diagnose It
First, confirm the wait is real and not a temporary spike:
Run the wait statistics script twice, 15 to 30 minutes apart, and compare the delta. If PAGEIOLATCH_SH is consistently in the top few positions in both snapshots, it is real.
Find which databases and files are driving the reads:
SELECT
    DB_NAME(vfs.database_id) AS database_name,
    mf.physical_name,
    mf.type_desc,
    vfs.io_stall_read_ms AS read_stall_ms,
    vfs.num_of_reads,
    CASE WHEN vfs.num_of_reads > 0
         THEN CAST(vfs.io_stall_read_ms * 1.0 / vfs.num_of_reads AS decimal(10,1))
         ELSE 0
    END AS avg_read_ms,
    vfs.io_stall AS total_io_stall_ms
FROM sys.dm_io_virtual_file_stats(NULL, NULL) vfs
JOIN sys.master_files mf
    ON mf.database_id = vfs.database_id
   AND mf.file_id = vfs.file_id
ORDER BY vfs.io_stall_read_ms DESC;
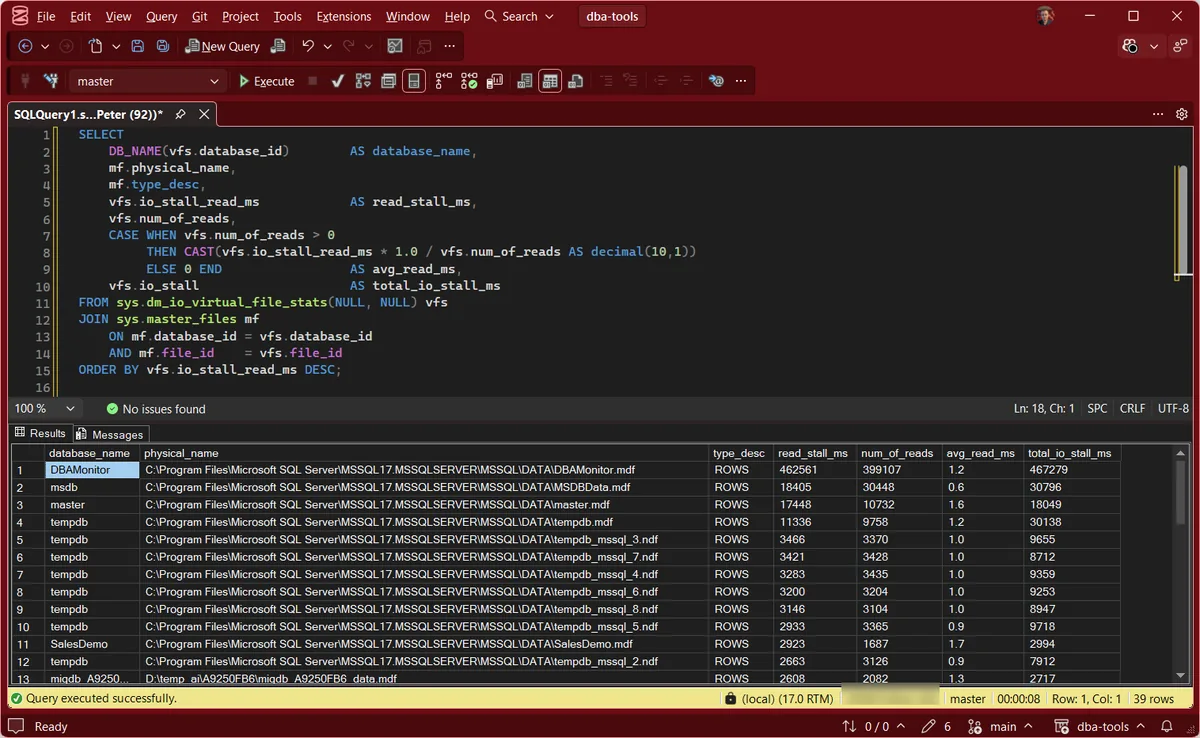
Files with high avg_read_ms (above 15 to 20 ms) indicate genuine storage latency. High read counts with low latency indicate buffer pool churn instead. Read the figures per file rather than as an instance average, because one slow volume among several is the common shape and an average hides it.
These counters are cumulative since the instance last started, so a bad hour last month is still in the total. If the numbers look worse than the server feels, capture the view twice a few minutes apart and compare the difference rather than trusting the running total.
Find which queries are doing the most reads:
SELECT TOP 20
    qs.total_logical_reads / qs.execution_count  AS avg_logical_reads,
    qs.total_logical_reads,
    qs.execution_count,
    SUBSTRING(qt.text, (qs.statement_start_offset / 2) + 1,
        ((CASE qs.statement_end_offset WHEN -1 THEN DATALENGTH(qt.text)
          ELSE qs.statement_end_offset END - qs.statement_start_offset) / 2) + 1) AS statement_text
FROM sys.dm_exec_query_stats qs
CROSS APPLY sys.dm_exec_sql_text(qs.sql_handle) qt
ORDER BY qs.total_logical_reads DESC;
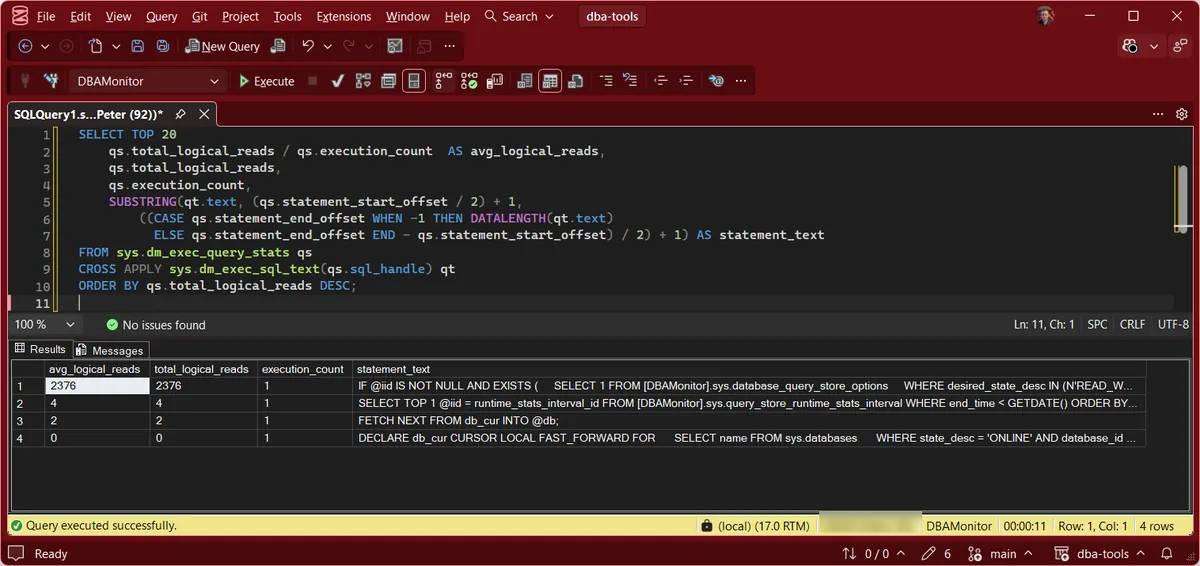
That second capture is from a mostly idle instance, which is worth saying rather than hiding: four rows, and the top one is Query Store housekeeping. sys.dm_exec_query_stats only knows what is still in the plan cache, so on a quiet server, or one under memory pressure that evicts plans quickly, it will under-report. Run it while the workload you care about is actually running.
Check missing indexes, if logical reads are high on a table, check whether there is a missing index that would turn a scan into a seek:
.\run.ps1 Get-MissingIndexes
What To Do
Which fix applies depends entirely on what the diagnosis above returned. These are not steps to work through in order; pick the row that matches your evidence.
Related Scripts
- Get-WaitStatistics, the overview script that surfaces this wait type
- Get-MissingIndexes, find indexes that would reduce scan reads
- Get-DatabaseIoUsage, per-database read and write latency, which is where this wait is confirmed or ruled out
- Get-DatabaseFileDetails, the files behind those numbers, with their growth and max size
- ASYNC_IO_COMPLETION, the other side of the storage story, where the wait is a background operation rather than a query
Leave a Reply