
ASYNC_NETWORK_IO appears when SQL Server has finished producing rows and is waiting for the client application to read them from the network buffer. SQL Server filled its output buffer, the client hasn’t acknowledged it yet, and SQL Server is sitting idle waiting to send the next batch.
This wait type is almost always an application-layer issue, not a SQL Server or network infrastructure problem. The name is slightly misleading, it’s not about the network being slow, it’s about the client being slow to consume results.
Is This Wait Expected?
Very common and almost always harmless. You will see ASYNC_NETWORK_IO in the wait stats of virtually every server that runs SSMS queries, reporting tools, or ETL processes. It does not indicate a SQL Server problem in the vast majority of cases.
It’s worth investigating only when:
- It’s your #1 wait by a very large margin (40%+ of all wait time)
- You’re seeing specific complaints about queries that are slow to return results to applications
- You suspect a specific application is consuming rows one at a time in a cursor-like loop
When To Ignore It
SSMS result grid, SSMS displays results incrementally as they arrive. Large result sets will always generate ASYNC_NETWORK_IO because SSMS is rendering and scrolling the grid while SQL Server waits. This is completely normal.
Reporting tools, SSRS, Crystal Reports, Power BI, Excel, all pull result sets and process them locally. Any tool reading a large result set generates ASYNC_NETWORK_IO. Expected.
ETL pulling large data sets, SSIS, custom ETL, or any process reading large volumes row by row across the network will show this wait. Normal for the workload.
Any query returning thousands of rows to an external application, if the application processes each row before reading the next, ASYNC_NETWORK_IO will be high. This is how most applications work and is not generally a problem unless rows are being processed very slowly.
Root Causes (When It Is Actually A Problem)
Enormous result sets, a query returning millions of rows when only a summary is needed. The application is doing aggregation or filtering work that should happen server-side in SQL. Every row sent across the network that isn’t needed generates unnecessary wait time.
Row-by-row cursor-style processing, an application reads one row, processes it (writes to a file, calls an API, updates another system), then reads the next. SQL Server sends a row and waits. The wait per row may be tiny but multiplied by millions of rows it accumulates.
High network latency between application and SQL Server, if the app server and SQL Server are across a WAN link, VPN, or different data centres, each round trip is slow. Normally SQL Server and applications are on the same LAN with sub-millisecond round trips. Cross-network queries raise this wait.
Application-side slow processing, the application is doing something slow between reads, logging, transformation, external lookups. SQL Server waits while the app is busy.
How To Diagnose It
Identify which sessions are currently in this wait:
SELECT
    r.session_id,
    r.wait_type,
    r.wait_time / 1000.0                AS wait_sec,
    r.row_count,
    r.reads,
    DB_NAME(r.database_id)              AS database_name,
    s.program_name,
    s.host_name,
    SUBSTRING(t.text, (r.statement_start_offset / 2) + 1,
        ((CASE r.statement_end_offset WHEN -1 THEN DATALENGTH(t.text)
          ELSE r.statement_end_offset END - r.statement_start_offset) / 2) + 1) AS current_statement
FROM sys.dm_exec_requests r
JOIN sys.dm_exec_sessions s ON s.session_id = r.session_id
CROSS APPLY sys.dm_exec_sql_text(r.sql_handle) t
WHERE r.wait_type = 'ASYNC_NETWORK_IO'
ORDER BY r.wait_time DESC;
Look at row_count (rows already sent), program_name (which application), and host_name (which server). A session that’s been in ASYNC_NETWORK_IO for minutes and has sent millions of rows is a real consumer.
Check what those queries are doing, are they returning enormous result sets? Are they queries that could have a WHERE clause, pagination, or aggregation added?
Check network latency, if the same query runs fast on the app server but slowly from a remote location, network latency is a factor.
What To Do
If queries return too many rows:
- Add WHERE clauses to filter earlier
- Add TOP or pagination (OFFSET/FETCH) to return only what’s needed
- Move aggregation into SQL (GROUP BY, SUM, COUNT) rather than returning raw rows to the application
If it’s cursor-style row-by-row processing:
- Refactor the application to process results in batches
- Consider server-side cursor alternatives (but usually set-based is better)
- Can the processing move into SQL Server (stored procedure, table-valued function)?
If it’s a reporting tool pulling large data sets:
- Review whether the report actually needs all those rows
- Add indexes to make the queries faster so the fetch time is reduced
- Consider pre-aggregating into summary tables for common report patterns
If network latency is genuinely high:
- Move application closer to SQL Server (same data centre)
- Check network infrastructure, QoS, routing, VPN encryption overhead
- Consider reducing the size of result sets to minimise round trips
Related Scripts
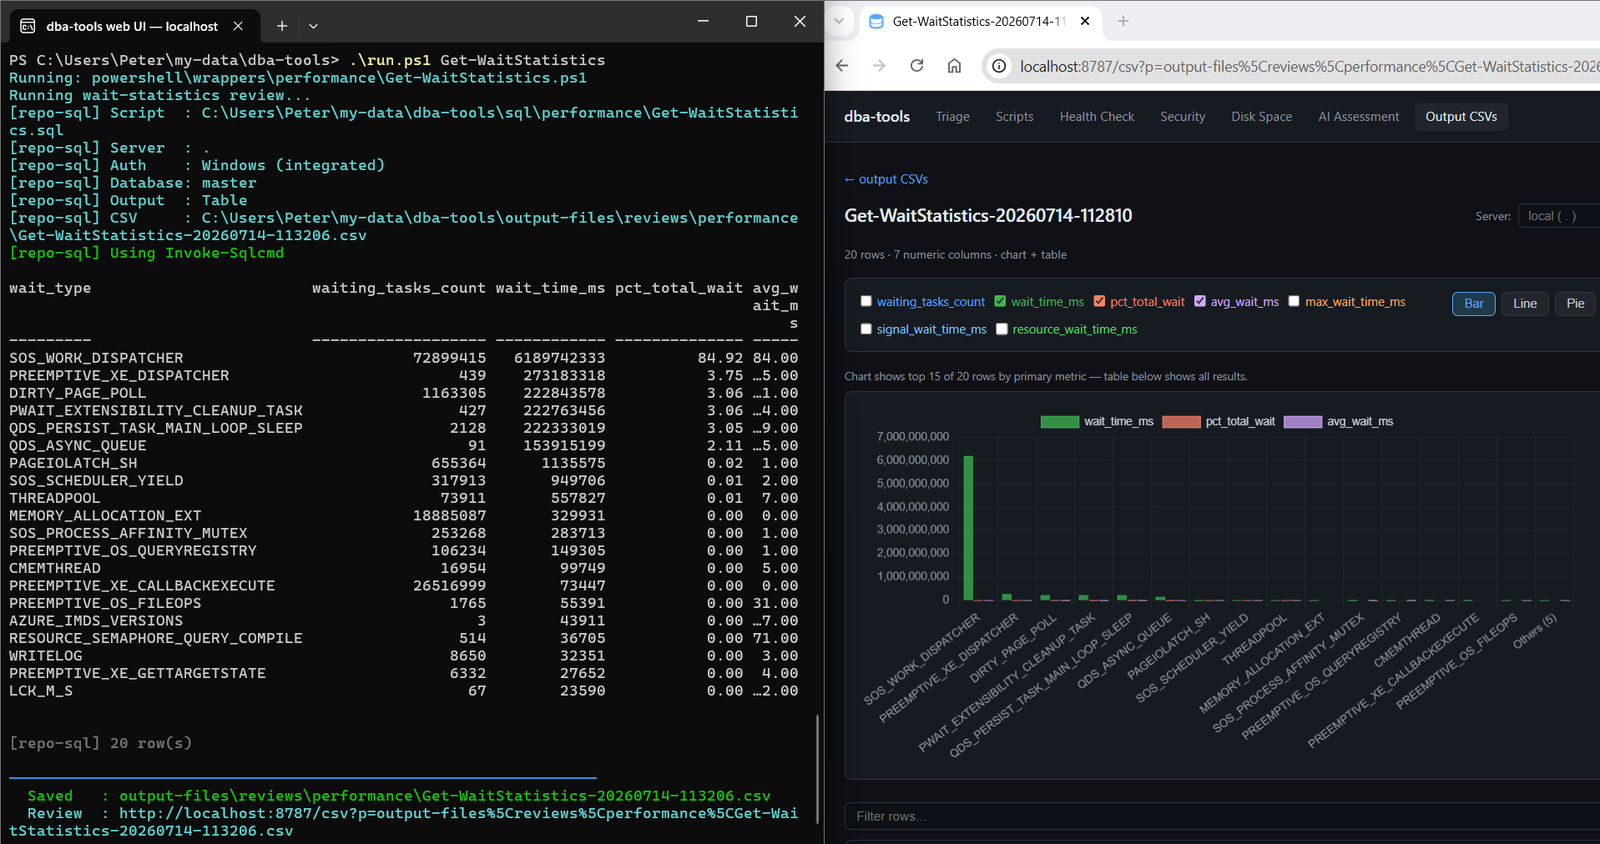
Get-WaitStatistics, the overview scriptGet-ActiveSessions, see all current sessions with wait types
Leave a Reply