
The phone call is always the same. “It timed out.” Somebody has been told the database is slow, you run the same query in SSMS and it comes back, and now you are the one who has to explain the difference. The difference is almost always that SSMS was not holding a stopwatch and the application was.
Msg -2 is not a SQL Server error number. Negative numbers come from the client library, and this one means the client’s own timer ran out, so it sent SQL Server a cancel and raised this to your code. SQL Server abandoned the work, rolled back whatever that statement had done, and carried on. It did not log anything, and it does not know or care that anyone was upset.
First, Check It Is Not the Other Timeout
Two different failures both get called “timeout expired” and they have nothing in common. Read the first two words of your message.
- “Execution Timeout Expired” (or, from the older
System.Data.SqlClient, just “Timeout expired”) means you were connected, the query started, and it did not finish in time. That is this page. - “Connection Timeout Expired”, or a message that opens “A network-related or instance-specific error occurred”, means you never got in at all. Nothing ran. That is a name resolution, port, firewall or service problem, and it belongs to Cannot Connect to SQL Server, which walks the checks in the order that finds it.
Here is the connection-stage failure for comparison, from a client pointed at an address with nothing listening on it. Note that it names the instance and the provider and says nothing about a query, because there was no query:
A network-related or instance-specific error occurred while establishing a connection to SQL Server.
The server was not found or was not accessible. Verify that the instance name is correct and that
SQL Server is configured to allow remote connections. (provider: TCP Provider, error: 0 - A connection
attempt failed because the connected party did not properly respond after a period of time, or
established connection failed because connected host has failed to respond.)
If that is your message, stop reading this page.
The One Query: Was It Blocked When It Timed Out?
Run this while the slow thing is still running, which means getting the report run again, or waiting for the next hourly job. One row per active request, and the column that decides your afternoon is blocked_by:
SELECT  r.session_id,
        r.blocking_session_id  AS blocked_by,
        r.wait_type,
        r.wait_time            AS wait_ms,
        r.wait_resource,
        r.status
FROM    sys.dm_exec_requests AS r
WHERE   r.session_id > 50
  AND   r.session_id <> @@SPID
ORDER BY r.blocking_session_id DESC, r.session_id;
On a lab instance with one session deliberately holding a lock and a second session queued behind it, taken 8 seconds into the wait:
session_id|blocked_by|wait_type|wait_ms|wait_resource                                      |status
----------|----------|---------|-------|---------------------------------------------------|---------
53        |77        |LCK_M_X  |7999   |APPLICATION: 20:0:[Lab1001_invoice_batch]:(ad672089)|suspended
77        |0         |WAITFOR  |11434  |                                                   |suspended
That is the whole answer in one row. Session 53 is not slow. Session 53 has done nothing at all for 8 seconds because session 77 has what it needs. Three outcomes, and they send you to three different places:
blocked_byis not 0. It was blocked. The slow query is innocent and the session named in that column is your problem. Go to SQL Server Blocking Troubleshooting, and if the chain is more than two deep, Get Blocking Chains draws it for you.blocked_byis 0 andwait_typeis set. It is waiting on something that is not another session: memory, disk, a parallel worker. The wait type names it, and the wait statistics library says what each one means.blocked_byis 0,statusisrunning, and it stays that way. The query is genuinely doing work and genuinely takes longer than the application allows. Now you have a tuning job. Get Long Running Queries gives you the list with the plans attached.
If you need the blocker gone right now, How to Kill a SPID covers doing it and the part people skip, which is what the rollback then costs you.
The catch is that sys.dm_exec_requests is a live view and nothing else.
Twelve Seconds Later, Session 53 Is Gone
Same query, same instance, after the client gave up:
session_id|blocked_by|wait_type|wait_ms|wait_resource|status
----------|----------|---------|-------|-------------|---------
77        |0         |WAITFOR  |24206  |             |suspended
Session 53 is gone. Not finished, not failed, gone, because the request stopped existing the moment the cancel arrived. This is why “it timed out at 3am and I looked at 9am” is unanswerable from the DMVs, and why the section below on attention events exists. See sys.dm_exec_requests on MS Docs for the full column list.
Whose Timeout Is It? SSMS Has Two, and Neither Is 30 Seconds
This is the part that causes the argument with the developer, so it is worth being exact. There are at least three separate timers in play and they have different owners and different defaults.
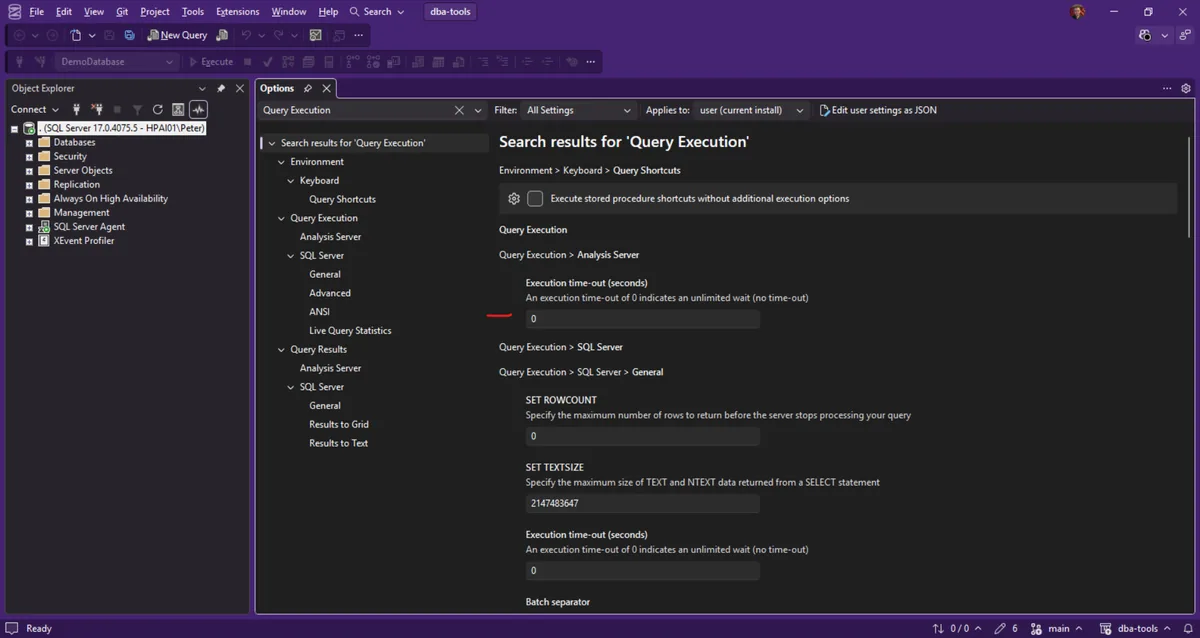
- The SSMS query window. Tools > Options > Query Execution > SQL Server > General, the box marked “Execution time-out”, in seconds. It ships at 0, and 0 means no limit. That is why your query “works fine in SSMS”. Changing it affects new query windows, not ones already open.
- The SSMS table designer, which has its own. Tools > Options > Designers > Table and Database Designers, “Transaction time-out after”, which defaults to 30 seconds and is the one that bites when a column change on a large table dies with a timeout while the same change by hand in a query window would have run. The designer rebuilds the table inside a transaction, so 30 seconds is nothing.
- The application. A
SqlCommandin .NET defaults to 30 seconds and most frameworks inherit that. This is the number in your incident, nearly every time.
The command-line clients behave like the query window, not like the application. sqlcmd with no -t switch ran a 40 second query to the end without complaining, 09:13:58 to 09:14:38. Give it a limit and the same client gives up on schedule. -t 5 against a statement that waits 10 seconds:
sqlcmd -S . -E -C -t 5 -Q "WAITFOR DELAY '00:00:10'; SELECT 'never gets here' AS note;"Two things about what comes back are worth carrying into a job design review. The message is two words, Timeout expired, with no session number, no statement and no clue what it was waiting on. And the process still exited with code 0, so a batch file or an agent step that only checks the exit code will treat that run as a success.
The application default is just as easy to prove. A SqlCommand left alone, against a statement that waits 40 seconds, gave up at 30,058 milliseconds. The default is documented as 30 seconds on SqlCommand.CommandTimeout, and the measurement agrees to within a twentieth of a second.
Which driver the application uses decides the wording, which matters when you are searching for it. The modern Microsoft.Data.SqlClient, the one SSMS 21 and 22 and current .NET use, produces the message in the box at the top of this page, followed by Msg -2, Level 11, State 0, Procedure , Line 0. The older System.Data.SqlClient, still in plenty of .NET Framework applications, says the same thing without the first word:
Timeout expired.  The timeout period elapsed prior to completion of the operation or the server is not responding.
Operation cancelled by user.
Same event, same Msg -2, different wording. If you are grepping application logs for one of these, grep for “timeout period elapsed”, which both share.
What SQL Server Records: An Attention Event, and Nothing Else
A client giving up is called an attention. It is not an error on the server side, so the usual places you would look are empty. On the lab instance, across a window containing five client timeouts, the error log held 115 entries and 3 of them matched the word “timeout”. All 3 were the name of the lab database. Nothing was written about the timeouts themselves.
The system_health Extended Events session, which is running on your instance right now and is the first thing most people check, does not help either. Joining sys.server_event_session_events to sys.server_event_sessions for the system_health session returns 21 events, and attention is not one of them.
So if you want to answer “which query timed out, and when” after the fact, you have to have been collecting it. One session, cheap, and it is the single highest-value thing you can leave running on an instance where people keep reporting timeouts:
CREATE EVENT SESSION CaptureAttention ON SERVER
ADD EVENT sqlserver.attention
(
    ACTION (sqlserver.session_id, sqlserver.client_hostname, sqlserver.client_app_name,
            sqlserver.database_name, sqlserver.sql_text, sqlserver.username)
)
ADD TARGET package0.ring_buffer (SET max_memory = 4096)
WITH (MAX_DISPATCH_LATENCY = 5 SECONDS, STARTUP_STATE = OFF);

ALTER EVENT SESSION CaptureAttention ON SERVER STATE = START;
Read it back with one statement:
SELECT  CAST(t.target_data AS xml) AS captured
FROM    sys.dm_xe_sessions AS s
JOIN    sys.dm_xe_session_targets AS t
        ON t.event_session_address = s.address
WHERE   s.name = 'CaptureAttention'
  AND   t.target_name = 'ring_buffer';
This is the event for session 53, the one in the blocked capture further up. It is the record the DMVs could not give you, and it names the statement:
<event name="attention" package="sqlserver" timestamp="07:57:06.841Z">
  <data name="duration"><value>202213</value></data>
  <data name="request_id"><value>0</value></data>
  <action name="username"><value>HPAI01\Peter</value></action>
  <action name="sql_text"><value>SET NOCOUNT ON;
BEGIN TRANSACTION;
DECLARE @rc int;
EXEC @rc = sp_getapplock @Resource = 'Lab1001_invoice_batch',
                         @LockMode = 'Exclusive',
                         @LockOwner = 'Transaction',
                         @LockTimeout = -1;
SELECT @rc AS applock_result;
ROLLBACK TRANSACTION;</value></action>
  <action name="database_name"><value>Lab1001_timeout</value></action>
  <action name="client_app_name"><value>SQLCMD</value></action>
  <action name="client_hostname"><value>HPAI01</value></action>
  <action name="session_id"><value>53</value></action>
</event>
The type nodes and the date part of the timestamp have been stripped here to keep it readable; everything else is as the server wrote it. One warning on reading it: duration on an attention event is not how long the query ran. Across the same five timeouts it came back as 1672, 2066, 3040, 42592 and 202213 microseconds, which bears no relation to the 5, 10, 15 and 60 second limits that produced them. What you want is the timestamp and the sql_text. For the timing, line that timestamp up with whatever you are collecting for long-running queries. Extended Events on MS Docs covers targets and filtering if you want to add a filter so a busy instance does not fill the ring buffer.
The other half of the picture is the blocked process report, which fires on the server when a session has been blocked past a threshold you set, and does not need anybody to have timed out. Pairing the two is how you prove “it timed out because it was blocked” rather than guessing. Understand and resolve blocking on MS Docs sets it up.
Raising the Timeout Is Not a Fix
It will be the first thing you are asked for, because it is a one line change in a config file and it makes the ticket go away today. Be clear about what it does and does not do.
If the query was blocked, raising the timeout changes nothing except how long the user stares at a spinner. The query was not working. It was queued behind a lock, and it will still be queued behind a lock at 60 seconds and at 120. What has actually changed is that the application now holds its connection, and whatever locks it already took, for twice as long, so you have made the blocking worse for everyone behind it. In the capture above, session 53 had done zero work in 8 seconds. Ten times the timeout would have bought ten times the nothing.
If the query is genuinely long and the business genuinely needs it, raising the timeout is the right answer, and that is a real case. A nightly reconciliation that honestly takes 4 minutes should not be fighting a 30 second default. Set it on that command, not globally, and write down why.
There is also a middle option people forget, which is to fail faster and on purpose. SET LOCK_TIMEOUT makes a statement give up waiting for a lock after a set number of milliseconds and raise error 1222, a proper SQL Server error with a session number attached, instead of a silent client-side cancel at 30 seconds. See Lock Request Time Out Period Exceeded (1222) for what that error looks like and when to use it, and SET LOCK_TIMEOUT on MS Docs for the syntax.
Common Questions
Timeout expired in the application, but the query runs fine in SSMS. Why?
How do I increase the query timeout in SSMS?
The table designer times out saving a change, but the same change works in a query window.
Does SQL Server log a timeout anywhere?
system_health. On the lab instance, a window containing five client timeouts produced 115 error log entries, of which 3 matched the word “timeout” and all 3 were the database name. The server does not consider a client hanging up to be an error. The event exists, it is called attention, and it is only recorded if you have an Extended Events session collecting it, which is the script in the attention section above.The timed-out statement was half way through an update. Is the data in a mess?
Can I set a default command timeout for the whole application instead of per query?
It only times out at 9am and 5pm. What is special about those?
A timeout is a symptom with three possible causes, and you now know which one you have. These are the pages for each.
- SQL Server Blocking Troubleshooting, for when
blocked_bywas not 0, which is most of the time. - The Query Is Fast in SSMS but Slow From the Application, the SET ARITHABORT gap between SSMS and the application is the other reason the same query behaves differently by client
- Lock Waits (LCK_M_*), what the wait type in that capture actually means and what drives it.
- SSMS Complete Guide, where the options dialogs in this page live, and the rest of the client.
- Cannot Connect to SQL Server, if it turned out you never got a connection at all.
- Get Blocking Chains, the lead blocker and everything queued behind it.
- Get Long Running Queries, what is running right now and how long it has been at it.
- How to Kill a SPID in SQL Server, when the blocker has to go, and what the rollback costs.
- Lock Request Time Out Period Exceeded (1222), the server-side timeout you can ask for on purpose.
Leave a Reply