
Query Store is SQL Server’s built-in flight recorder for query performance: every query’s plan, runtime stats, and history, retained and queryable without any extra tracing setup. Most instances have had it available since SQL Server 2016, and a surprising number still have it switched off, which means every “what changed” investigation starts from nothing.
This script surfaces the top queries by CPU, duration, execution count, or plan regression, whichever angle matters for the investigation, and flags queries with multiple plans or a forced plan along the way.
Why Query Store Top Queries Matters
Without Query Store, “what’s using the most CPU right now” is answerable from the plan cache (Get Top CPU Queries), but “what was using the most CPU an hour ago, and did its plan change” usually isn’t:
- Query Store retains history across plan cache evictions and even service restarts, unlike
sys.dm_exec_query_stats - Multiple plans for the same query is a direct signal of plan instability, worth investigating even before performance visibly regresses
- A
cpu_regression_factorwell above 1.0 means the current plan is measurably worse than the best one Query Store has seen for that query - One query, sortable by whichever metric matters for the investigation at hand
When to Run This Script
- Investigating a query or workload that’s regressed
- Routine SQL Server health checks
- After a deployment, to check for new plan instability
- Reviewing a database you’ve just inherited, to see what’s actually expensive
The Script
Run the following script against your SQL Server instance.
- Tested on: SQL Server 2025 (RTM CU8), Windows lab instance
- Last verified: 2026-09-08 (saved output from a real run, Get-QueryStoreTopQueries-20260908-122555.csv)
- Permissions: VIEW DATABASE STATE
- Safety: read-only, impact low
/*
Script Name : Get-QueryStoreTopQueries
Category    : performance
Purpose     : Top queries from Query Store by CPU, duration, execution count, or plan regressions.
              Change @sort_by at the top to switch modes. Must run in the context of the target
              database, change the database in SSMS or pass -Database <dbname> via the PS wrapper.
Author      : Peter Whyte (https://sqldba.blog/dba-scripts-get-query-store-top-queries/)
Requires    : VIEW DATABASE STATE
*/
-- SAFE:ReadOnly
-- IMPACT:Low
SET NOCOUNT ON;

DECLARE @top INT = 25;
DECLARE @hours INT = 24; -- look-back window in hours (0 = all history)
DECLARE @sort_by VARCHAR(20) = 'cpu'; -- cpu | duration | executions | regressions
DECLARE @min_executions INT = 5; -- filter queries with fewer executions (reduces noise)

-- Guard: return informational row if Query Store is not enabled on this database
IF ISNULL((SELECT actual_state_desc FROM sys.database_query_store_options), 'OFF')
   NOT IN ('READ_WRITE', 'READ_ONLY')
BEGIN
    SELECT
        DB_NAME() AS current_database,
        ISNULL(
            (SELECT actual_state_desc FROM sys.database_query_store_options),
            'OFF'
        ) AS query_store_status,
        'Enable: ALTER DATABASE [' + DB_NAME() + '] SET QUERY_STORE = ON (OPERATION_MODE = READ_WRITE)' AS action;
END
ELSE
BEGIN
    WITH
    agg AS (
        SELECT
            q.query_id,
            OBJECT_NAME(q.object_id) AS object_name,
            LEFT(qt.query_sql_text, 500) AS query_text,
            p.plan_id,
            p.is_forced_plan,
            p.last_execution_time,
            SUM(rs.count_executions) AS execution_count,
            CAST(AVG(rs.avg_duration) / 1000.0 AS DECIMAL(14,2)) AS avg_duration_ms,
            CAST(MAX(rs.max_duration) / 1000.0 AS DECIMAL(14,2)) AS max_duration_ms,
            CAST(AVG(rs.avg_cpu_time) / 1000.0 AS DECIMAL(14,2)) AS avg_cpu_ms,
            CAST(MAX(rs.max_cpu_time) / 1000.0 AS DECIMAL(14,2)) AS max_cpu_ms,
            CAST(AVG(rs.avg_logical_io_reads) AS DECIMAL(14,2)) AS avg_logical_reads,
            CAST(AVG(rs.avg_rowcount) AS DECIMAL(14,2)) AS avg_rows,
            COUNT(*) OVER (PARTITION BY q.query_id) AS plan_count
        FROM sys.query_store_runtime_stats rs
        JOIN sys.query_store_runtime_stats_interval ri ON rs.runtime_stats_interval_id = ri.runtime_stats_interval_id
        JOIN sys.query_store_plan p ON rs.plan_id = p.plan_id
        JOIN sys.query_store_query q ON p.query_id = q.query_id
        JOIN sys.query_store_query_text qt ON q.query_text_id = qt.query_text_id
        WHERE (@hours = 0 OR ri.start_time >= DATEADD(HOUR, -@hours, GETUTCDATE()))
          AND q.is_internal_query = 0
        GROUP BY
            q.query_id, q.object_id, qt.query_sql_text,
            p.plan_id, p.is_forced_plan, p.last_execution_time
    ),
    with_best AS (
        -- Attach the best avg_cpu_ms seen for this query across all its plans
        SELECT
            a.*,
            MIN(a.avg_cpu_ms) OVER (PARTITION BY a.query_id) AS best_avg_cpu_ms
        FROM agg a
    ),
    latest_plan AS (
        -- For each query keep only its most-recently-used plan; compute regression factor
        SELECT
            *,
            ROW_NUMBER() OVER (PARTITION BY query_id ORDER BY last_execution_time DESC) AS plan_rank,
            CAST(
                CASE WHEN best_avg_cpu_ms > 0
                     THEN avg_cpu_ms / best_avg_cpu_ms
                     ELSE 1.0
                END AS DECIMAL(10,2)
            ) AS cpu_regression_factor
        FROM with_best
    )
    SELECT TOP (@top)
        lp.query_id,
        lp.plan_id,
        lp.object_name,
        lp.plan_count,
        lp.avg_cpu_ms,
        lp.max_cpu_ms,
        lp.avg_duration_ms,
        lp.max_duration_ms,
        lp.execution_count,
        lp.avg_logical_reads,
        lp.avg_rows,
        lp.is_forced_plan,
        lp.cpu_regression_factor,
        CASE
            WHEN lp.cpu_regression_factor > 2.0 AND lp.plan_count > 1 THEN 'REGRESSED'
            WHEN lp.is_forced_plan = 1 THEN 'PLAN_FORCED'
            WHEN lp.plan_count > 1 THEN 'MULTI_PLAN'
            ELSE 'OK'
        END AS plan_status,
        lp.last_execution_time,
        lp.query_text
    FROM latest_plan lp
    WHERE lp.plan_rank = 1
      AND lp.execution_count >= @min_executions
      AND (
            @sort_by <> 'regressions'
            OR (lp.plan_count > 1 AND lp.cpu_regression_factor > 1.5)
          )
    ORDER BY
        CASE @sort_by
            WHEN 'cpu' THEN lp.avg_cpu_ms
            WHEN 'duration' THEN lp.avg_duration_ms
            WHEN 'executions' THEN CAST(lp.execution_count AS DECIMAL(14,2))
            WHEN 'regressions' THEN lp.cpu_regression_factor
            ELSE lp.avg_cpu_ms
        END DESC;
END;
The script checks whether Query Store is enabled first and returns an informational row with the exact command to enable it if not. When it is, it aggregates sys.query_store_runtime_stats by query and plan, keeps each query’s most recent plan, and returns the top N sorted by whichever metric you choose.
How To Run From The Repo
Clone DBA Tools, initialize and run the script:
# Clone dba-tools repo:
git clone https://github.com/peterwhyte-lgtm/dba-tools

# Initialize environment:
cd dba-tools
.\Initialize-Environment.ps1

# Top queries by CPU in a specific database:
.\run.ps1 Get-QueryStoreTopQueries -Database YourDatabaseName

# To run against a remote sql server:
.\run.ps1 Get-QueryStoreTopQueries -ServerInstance SQLSERVER01 -Database YourDatabaseName
This script lives in the repo at:
sql/performance/query-store/Get-QueryStoreTopQueries.sqlpowershell/wrappers/performance/query-store/Get-QueryStoreTopQueries.ps1
Example Output
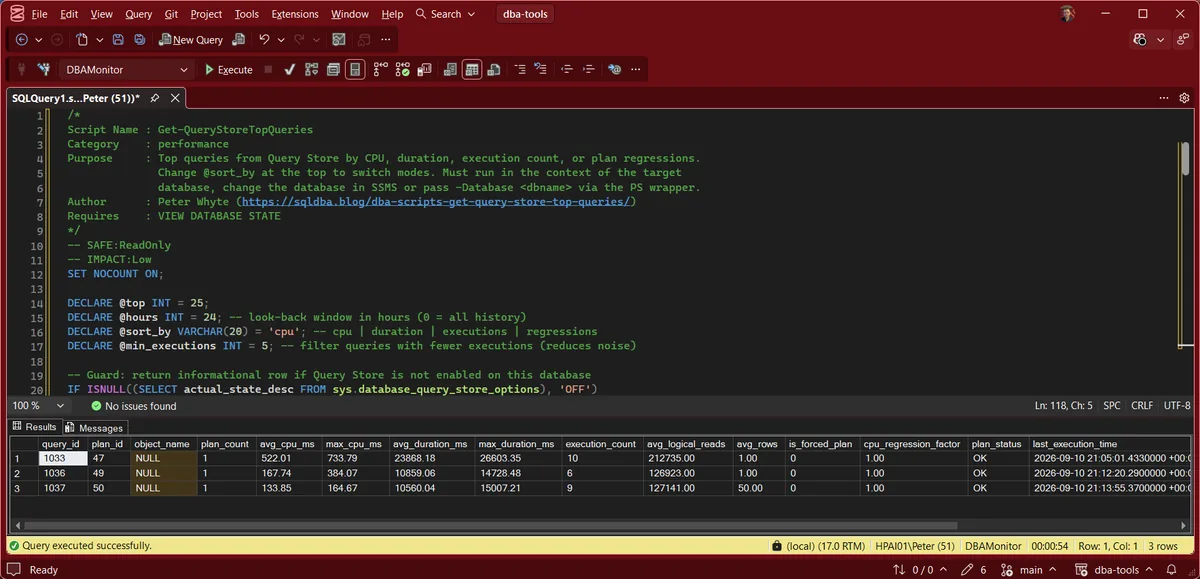
Query Store starts out disabled on most databases, this script’s guard clause exists for exactly that:
After enabling it and generating some real activity, the populated result looks like this (real Query Store data, @min_executions relaxed for this lab’s light traffic):
Understanding the Results
One row per query, its most recent plan, sorted by @sort_by. Every column the script returns:
query_idplan_idquery_id is stable for the life of the query text; plan_id is the plan the row describes, and only the query’s most recently used plan is returned. Both are what sp_query_store_force_plan takes.object_nameNULL for ad hoc and prepared statements.plan_countavg_cpu_msmax_cpu_msavg_duration_msmax_duration_msexecution_count@min_executions (5 by default) are filtered out so one-off statements do not crowd the list.avg_logical_readsavg_rowsis_forced_plan1 if this plan is forced, by a person or by automatic plan correction. Query Store honours the forced plan on every compile until it is unforced or fails to force.Act when a forced plan is still at the top of the list. The plan that fixed last quarter’s regression may be the one causing this one.cpu_regression_factoravg_cpu_ms divided by the best avg_cpu_ms any of the query’s plans achieved in the window. 1.00 means this is the best plan seen; 3.00 means the current plan costs 3 times the CPU the query has proved it can run at.plan_statusREGRESSED when the factor is above 2.0 and more than one plan exists, PLAN_FORCED when the plan is forced, MULTI_PLAN when there is more than one plan but no regression, otherwise OK.Act when REGRESSED. That is a query with a proven better plan that it is no longer using, and forcing the better plan is a one-statement stopgap.last_execution_timequery_textsys.query_store_query_text by query_id when you need it.current_databasequery_store_statusactionaction is the exact ALTER DATABASE to enable it. The script is database-scoped, so running it from master nearly always returns this row.Act when you see this row on a database you believed had Query Store on. query_store_status reports the actual state, and READ_ONLY means it has stopped capturing.How to Fix Query Store Regressions
For a query flagged REGRESSED, compare its current plan against its best historical plan (both available via sys.query_store_plan for the same query_id) to see what changed, an index drop, a statistics update, a parameter sniffing case, or a schema change.
-- Force the best-known plan for a specific query (use with care, and monitor after)
EXEC sp_query_store_force_plan @query_id = <query_id>, @plan_id = <plan_id>;

-- Later, once the underlying cause is fixed, unforce it
EXEC sp_query_store_unforce_plan @query_id = <query_id>, @plan_id = <plan_id>;
Forcing a plan is a stopgap, not a fix; it buys time while the actual cause (stale stats, a missing index, a parameter sniffing pattern) gets addressed properly.
Best Practices
- Enable Query Store on every database that doesn’t have a good reason not to; the overhead is low and the visibility is worth it.
- Review
REGRESSEDqueries after every deployment, not just when something is reported slow. - Don’t leave a forced plan in place indefinitely without understanding why it was needed; it can mask a problem that gets worse over time.
Microsoft’s reference covers sys.database_query_store_options and sys.dm_exec_query_stats in full.
Related Scripts
You may also find these scripts useful:
- Query and Performance Tuning (hub)
- Query Store Status
- Query Store Regressions and Forced Plans
- Top CPU Queries, the plan-cache view of the same question when Query Store is off
- SQL Server High CPU, the walkthrough that decides working versus waiting before any setting is touched
- DBA Scripts: The Complete Guide, the map across every script on this site
Frequently Asked Questions
Does enabling Query Store slow anything down?
The overhead is generally small (single-digit percent, workload-dependent) and it is on by default for new databases from SQL Server 2022. For most workloads the visibility is worth the cost; test on a representative workload if you’re cautious.
How far back does Query Store history go?
Configurable via QUERY_STORE (RETENTION_PERIOD = ...), default varies by SQL Server version. Longer retention means more history to investigate but more storage used; size it to your actual investigation needs.
Summary
Query Store turns “what changed” from a guess into a query. Its value is highest exactly when you need it most, mid-incident, trying to figure out whether a query genuinely got slower or just looks that way.
Run this script whenever a query or workload is under investigation, and check for REGRESSED status after every deployment as a matter of routine.
Leave a Reply