
An application cannot connect, and before you look at firewalls, DNS or logins you need one fact: is SQL Server listening on this machine, and on which port? Ask Windows which ports the sqlservr process holds, then ask SQL Server which port it bound at startup. If the two agree and the client still fails, the fault is somewhere between the client and this server, not on it.
Checking Listening Ports from PowerShell
If you are on the server, or on a remote session with no desktop, this is the fastest answer. Start from the process rather than the port, because the port is the thing you are not sure of:
# Every TCP port the SQL Server process is listening on
Get-NetTCPConnection -State Listen -OwningProcess (Get-Process sqlservr).Id |
    Select-Object LocalAddress, LocalPort, OwningProcess |
Sort-Object LocalPortRead it by address. 1433 on 0.0.0.0 and :: is the instance listening on every IPv4 and IPv6 address, which is what a remote client needs; 2 rows for 1 port is normal, because SQL Server binds IPv4 and IPv6 separately. 1434 on 127.0.0.1 and ::1 is the Dedicated Administrator Connection, bound to this machine only. The third pair is a dynamic loopback port (Service Broker on this instance) and will be a different number on yours. A named instance shows its own dynamic port here in place of 1433, which is the number the client actually needs. If more than 1 instance runs on the server, (Get-Process sqlservr).Id returns every PID and you get every instance's rows, so tell them apart by OwningProcess.
When the question is the other way round, which process owns a port, filter on the port and resolve the PID to a name. That resolution is what proves the port belongs to SQL Server rather than to something else that claimed it first:
# What is listening on a port, and which process owns it
Get-NetTCPConnection -State Listen -LocalPort 1433 |
    Select-Object LocalAddress, LocalPort, State, OwningProcess,
        @{ Name = 'Process'; Expression = { (Get-Process -Id $_.OwningProcess).ProcessName } }
On the lab that returns the same 2 rows for 1433, both owned by PID 7188, process sqlservr. Both filters take a list of values, as the Get-NetTCPConnection reference on MS Docs shows. The cmdlet is TCP only, so it will never show the SQL Server Browser, which listens on UDP 1434: Get-NetUDPEndpoint -LocalPort 1434 answers that, and on a server where the Browser is stopped it errors with No MSFT_NetUDPEndpoint objects found with property 'LocalPort' equal to '1434'.
When Nothing Is Listening
Filter on a port nobody holds and the cmdlet does not return an empty list, it raises an error. This is the same query against port 1499 on the lab:
That error is the answer, not a fault in the command: nothing on this machine is listening on that port, so a client aimed at it is refused whatever the firewall says. The usual reasons, in the order worth checking:
- The service is not running.
Get-Process sqlservrfinds no process, so there is nothing to own a port. Start there. - TCP/IP is disabled for the instance. The process runs but holds no network port at all. Enabling TCP Connections in SQL Server covers the fix, and it needs a service restart.
- It is listening, on a different port. The by-process query above shows the real number. Named instances take a dynamic port that can change on restart, which SQL Server Ports: 1433, Dynamic Ports and Firewall Rules explains.
Checking Listening Ports with netstat
netstat is the fallback, and it is on every Windows build, including the ones too old for the NetTCPIP cmdlets. Filter on LISTENING as well as the port:
netstat -ano | findstr LISTENING | findstr ":1433 "
tasklist /fi "PID eq 7188"The second filter matters. findstr :1433 on its own returned 34 lines on the lab, because it also matches every client connection whose remote port is 1433 and every TIME_WAIT row left behind by closed sessions. An ESTABLISHED row only proves a session got in earlier, not that the port is still accepting new ones. The space after 1433 stops it matching 14330 and the like.
The last column of netstat -ano is the PID (the -o switch in the netstat reference on MS Docs), which is why the tasklist filter follows it. netstat -abno prints the executable name directly, but from a normal prompt it stops with The requested operation requires elevation., so run it from an elevated one. Add -p UDP when you are chasing the Browser.
Confirming the Port from SQL Server
Windows tells you what the process holds. SQL Server writes what it bound to its error log at every startup, which is the record to quote when somebody asks which port the instance is on. If you can connect locally, read it:
EXEC sp_readerrorlog 0, 1, N'Server is listening on';The same 3 ports as the PowerShell output, from the other side: 'any' is every address, and the 1434 pair is the Dedicated Administrator Connection on loopback. The 2 arguments after the log number are the product (1 is SQL Server) and a search string, per sp_readerrorlog on MS Docs. The current log only covers the current startup, so a port changed since the last restart will not appear here.
For the port your own session arrived on, SELECT local_tcp_port FROM sys.dm_exec_connections WHERE session_id = @@SPID; returned 1433 on the lab. It is NULL for a session that did not connect over TCP. For every listener in one result set, including which ones need a firewall rule, use the sys.dm_tcp_listener_states query in SQL Server Default Ports.
The configured port lives in SQL Server Configuration Manager: SQL Server Network Configuration, Protocols for the instance, TCP/IP, the IP Addresses tab, then the IPAll section at the bottom. On the lab instance TCP Port reads 1433 and TCP Dynamic Ports is blank. A 0 in TCP Dynamic Ports means the instance takes a dynamic port, and any change there only takes effect when the service restarts (TCP/IP Properties, IP Addresses tab, on MS Docs). When the configured port and the listening port disagree, the service has not been restarted since someone changed it.
Using Resource Monitor (Built-in Option)
Resource Monitor is built into Windows and provides detailed visibility into network activity, including listening ports.
It is the quickest graphical option when you want to confirm what is listening locally without installing anything.
Opening Resource Monitor
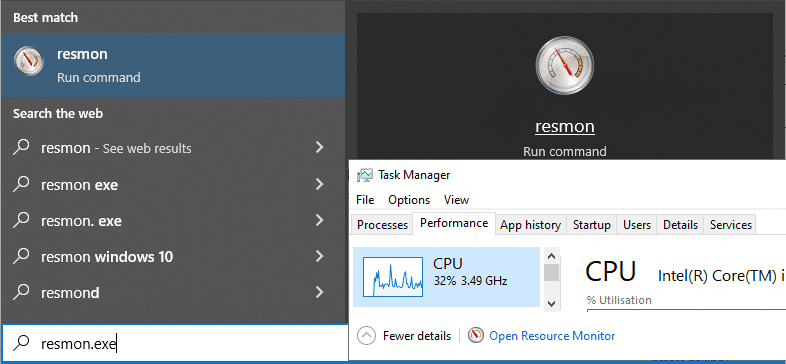
You can open Resource Monitor in a few ways:
- Press Win + R, type
resmon.exe, press Enter - Search for Resource Monitor in the Start menu
- Open Task Manager, go to the Performance tab, then click Open Resource Monitor
Viewing Listening Ports
Once Resource Monitor is open:
- Go to the Network tab
- Expand the Listening Ports section
You’ll see every TCP and UDP listener, with these columns:
- Image, the owning process
- PID
- Address, where IPv4 unspecified and IPv6 unspecified mean every address, and loopback means this machine only
- Port and Protocol
- Firewall Status, Windows Firewall's view of that listener, the column to read next when local connections work and remote ones do not
This makes it easy to confirm whether a service is actually listening and which executable is responsible for the port binding.

This view allows you to confirm port ownership immediately without leaving the server or installing additional tools.
Using TCPView (Sysinternals)
If you need more control, filtering, or ongoing visibility, TCPView is often the better tool.
TCPView is a lightweight Sysinternals utility that displays all TCP and UDP endpoints on a system in real time. It’s especially useful if you’re reviewing a lot of connections or narrowing down specific ports or processes.
MS Docs: TCPView (Sysinternals)
Why Use TCPView
TCPView is useful when:
- You need search and filtering
- You’re dealing with many active connections
- You want a clearer view than Resource Monitor provides
- You’re investigating unexpected listeners
It shows:
- Local and remote addresses
- Ports
- Connection state
- Owning process
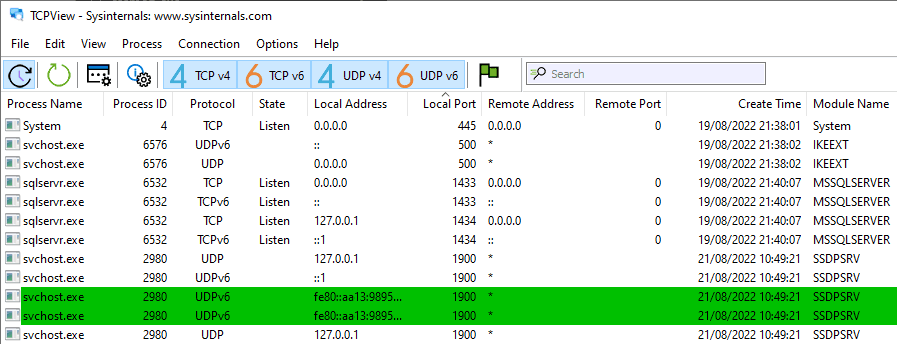
TCPView is particularly useful when multiple services are binding dynamically or when ports appear and disappear quickly during startup or failover scenarios.
Because it’s portable and quick to run, it’s a tool many Windows, DBA, and infrastructure admins keep handy.
What About Wireshark
Wireshark is a powerful tool, but it solves a different problem.
Wireshark captures and inspects network traffic. It does not tell you which process is listening on a port in a clean or authoritative way. For that reason, it is rarely the right first tool for checking listening ports.
Wireshark is appropriate when:
- You need to see packets arriving or leaving the server
- You suspect traffic is being dropped or altered mid path
- You are debugging protocol level behaviour
For basic port ownership and listening checks on Windows, Resource Monitor and TCPView are faster, clearer, and safer choices.
Choosing the Right Tool
- PowerShell and netstat
Fastest, scriptable, and the only ones that work over a remote session with no desktop. - The SQL Server error log
What the instance itself says it bound at startup, the record to quote in a ticket. - Resource Monitor
Best for quick, built-in checks on a local machine. - TCPView
Better for deeper inspection, filtering, and longer troubleshooting sessions.
All of them only read state, so they are safe to run on a production server mid-incident.
Final Notes
When diagnosing connectivity issues, check both sides:
- Can the client reach the destination port?
- Is something actually listening on that port, and which process owns it?
This page answers the second question. If the port is listening here and the client still cannot connect, run the remote port test from the client machine next.
Knowing what is listening locally is half the picture. These cover the other half.
- Testing Remote Server Port Connectivity with PowerShell, the client-side test of the same port.
- SQL Server Ports: 1433, Dynamic Ports and Firewall Rules, which ports SQL Server should be on, and which of them move.
- Enabling TCP Connections in SQL Server, the usual cause when nothing is listening on 1433 at all.
- How to Get the SQL Server IP Address, confirm the IP and port a session actually connected to.
- sqlcmd Examples for SQL Server, connect once the port is confirmed open.
- Cannot Connect to SQL Server: The Checks in the Order That Finds It, the router for every connection error, start here when you are not sure which one you have.
- DBA Scripts: Server and Configuration, the hub this sits in, every instance-level check that establishes what a server is and how it is configured.
Leave a Reply