This script provides a quick view of how SQL Server interprets the CPU layout of a server or VM.
It returns CPU counts, socket and core layout, NUMA node configuration, scheduler visibility, and key configuration values such as MAXDOP and cost threshold for parallelism.
I typically use this when validating a new SQL Server build, reviewing VM sizing, or investigating performance issues where CPU scheduling or configuration may be contributing factors.
Why This Matters
In production environments, CPU visibility and configuration issues can lead to:
- inefficient parallelism behaviour
- unexpected CPU pressure
- scheduler imbalance
- misleading performance diagnostics
This script helps confirm that SQL Server is correctly interpreting the underlying hardware before deeper tuning or troubleshooting begins.
What The Script Returns
- SQL Server instance and version metadata
- Logical CPU count and hyper-threading ratio
- Socket and core distribution
- NUMA node configuration
- Scheduler visibility and distribution
- Worker and task activity per scheduler
- CPU affinity configuration
- MAXDOP and cost threshold for parallelism
SQL Script
SET NOCOUNT ON;

-- SQL Server version and instance details
SELECT
    @@SERVERNAME AS server_name,
    SERVERPROPERTY('MachineName') AS machine_name,
    SERVERPROPERTY('InstanceName') AS instance_name,
    SERVERPROPERTY('Edition') AS edition,
    SERVERPROPERTY('ProductVersion') AS product_version,
    SERVERPROPERTY('ProductLevel') AS product_level,
    SERVERPROPERTY('EngineEdition') AS engine_edition,
    sqlserver_start_time
FROM sys.dm_os_sys_info;

-- CPU and NUMA topology overview
SELECT
    cpu_count AS logical_cpu_count,
    hyperthread_ratio,
    socket_count AS sockets,
    cores_per_socket,
    numa_node_count,
    scheduler_count,
    scheduler_total_count,
    max_workers_count,
    virtual_machine_type_desc
FROM sys.dm_os_sys_info;

-- NUMA node visibility and scheduler distribution
SELECT
    node_id,
    node_state_desc,
    memory_node_id,
    cpu_affinity_mask,
    online_scheduler_count,
    active_worker_count,
    avg_load_balance,
    timer_task_affinity_mask,
    permanent_task_affinity_mask,
    processor_group
FROM sys.dm_os_nodes
WHERE node_state_desc IS NOT NULL
AND node_state_desc <> 'ONLINE DAC'
ORDER BY node_id;

-- Scheduler activity overview
SELECT
    scheduler_id,
    parent_node_id,
    status,
    is_online,
    is_idle,
    current_tasks_count,
    runnable_tasks_count,
    current_workers_count,
    active_workers_count,
    work_queue_count,
    load_factor
FROM sys.dm_os_schedulers
WHERE scheduler_id < 255
AND status = 'VISIBLE ONLINE'
ORDER BY parent_node_id, scheduler_id;

-- CPU affinity and parallelism configuration
SELECT
    name,
    value,
    value_in_use,
    description
FROM sys.configurations
WHERE name IN
(
    'affinity mask',
    'affinity64 mask',
    'affinity I/O mask',
    'affinity64 I/O mask',
    'max degree of parallelism',
    'cost threshold for parallelism'
)
ORDER BY name;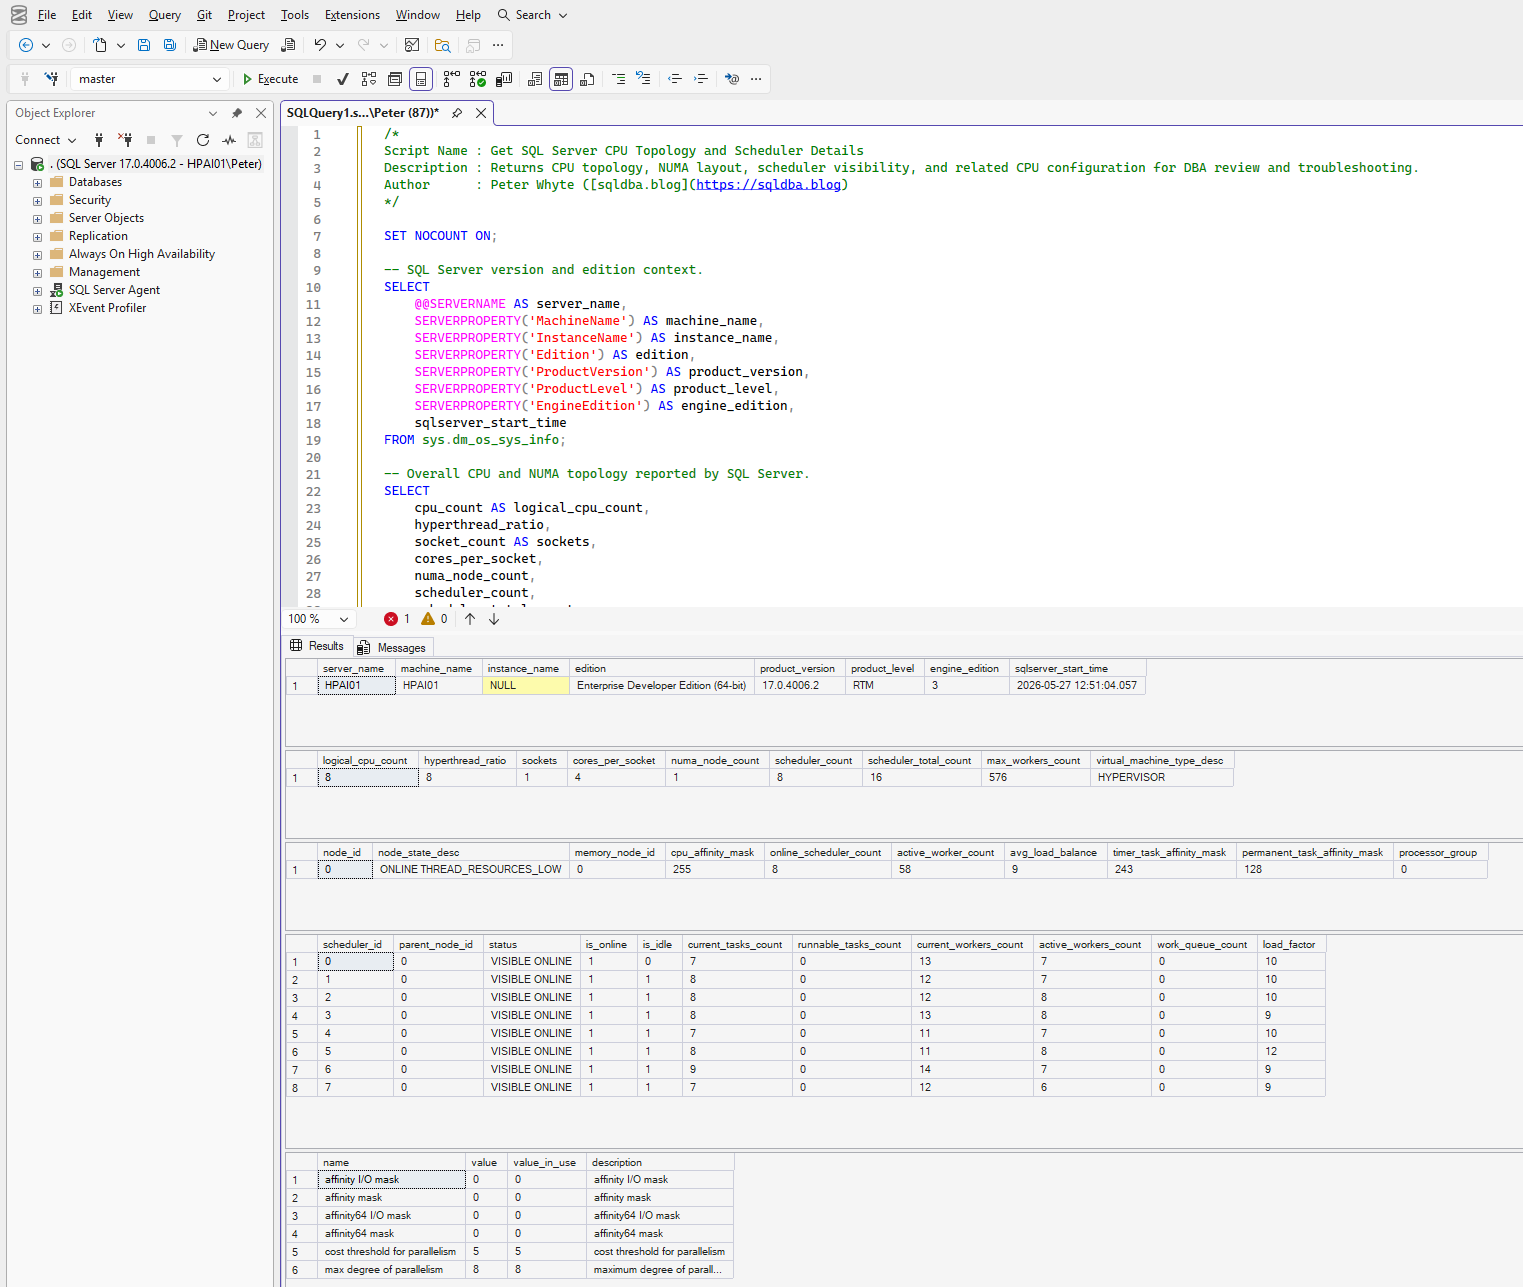
How I Use This In Production
I run this script during:
- new server or VM validation
- performance investigations involving CPU pressure
- configuration audits of MAXDOP and affinity settings
- troubleshooting unexplained scheduler behaviour
It gives a fast baseline view of how SQL Server perceives the compute environment.
Key Things To Check
- Logical CPU count matches expected VM or hardware allocation
- NUMA nodes align with physical architecture
- Scheduler distribution is balanced across nodes
- No persistent backlog in
runnable_tasks_count - MAXDOP is appropriate for workload (not left at default)
- Cost threshold for parallelism is not default in production
- CPU affinity is not artificially restricting schedulers
Example Interpretation
On a small system you might see:
- 8 logical CPUs
- 1 socket
- 4 cores per socket
- 1 NUMA node
On larger production systems you may see:
- multiple NUMA nodes
- processor groups (high core-count systems)
- distributed schedulers across nodes
If runnable_tasks_count or work_queue_count is consistently above zero across multiple schedulers, this may indicate CPU pressure worth investigating further.
Notes / Caveats
- This is not a full CPU health check
- Some metrics are transient and should be observed over time
- Hyper-threading can affect interpretation of logical CPU counts
- VM abstraction may hide underlying physical topology
- Best used as a baseline before deeper performance analysis
Related Scripts
- Blocking Session Analysis
- Wait Statistics Overview
- MAXDOP Configuration Check
- CPU Pressure Investigation
Source / Repository
This script is part of my DBA Tools Collection.
Repo Path: DBA Tools → /monitoring/sql/get-cpu-topology.sql
All scripts are designed for production troubleshooting and can be executed directly in SQL Server Management Studio.
Leave a Reply