This script returns replication latency information for databases participating in an Always On Availability Group (AG). It shows how far each secondary database is behind the primary, the redo queue size, redo rate, and an estimated recovery completion time.
It helps identify AG latency, redo backlog, and data movement delays between primary and secondary replicas.
This is commonly used during failover planning, replica performance troubleshooting, or when investigating data movement delays.
The Script
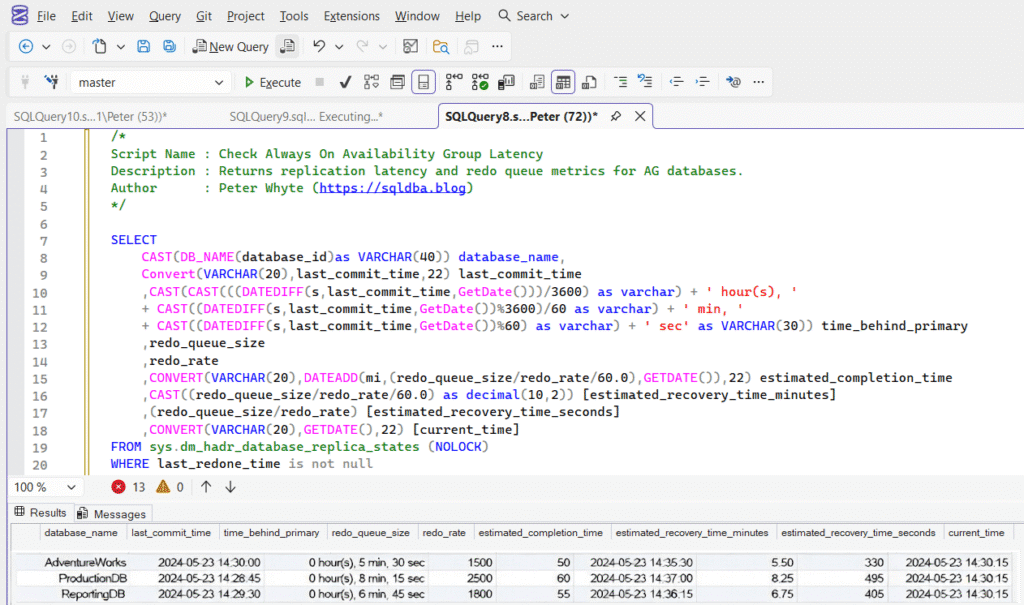
Example Output
The result set shows one row per Availability Group database replica.
Key columns:
- time_behind_primary – how long the secondary has been behind the last commit
- redo_queue_size – amount of log waiting to be redone
- redo_rate – speed at which redo is occurring
- estimated_recovery_time_minutes – approximate time required to catch up
This makes it easy to quickly determine whether a replica is healthy, slightly behind, or significantly delayed.
Notes
- Useful before planned failovers
- Large redo queue with low redo rate indicates potential secondary pressure
- Persistent lag may indicate I/O bottlenecks or network latency
- Only returns databases participating in Availability Groups
Leave a Reply