
This script gives a quick view of how SQL Server sees the CPU layout on a server.
It returns the SQL Server version and edition, CPU count, sockets, cores per socket, NUMA node count, scheduler visibility, and a few related configuration values such as MAXDOP, cost threshold for parallelism, and CPU affinity settings.
I find this useful when checking a new SQL Server build, reviewing a VM, investigating CPU pressure, or confirming that SQL Server can see the CPU layout I expect.
/*
Script Name : Get SQL Server CPU Topology and Scheduler Details
Description : Returns CPU topology, NUMA layout, scheduler visibility,
                and related CPU configuration for DBA review and troubleshooting.
Author      : Peter Whyte (https://sqldba.blog)
*/

SET NOCOUNT ON;

-- SQL Server version and edition context.
SELECT
    @@SERVERNAME AS server_name,
    SERVERPROPERTY('MachineName') AS machine_name,
    SERVERPROPERTY('InstanceName') AS instance_name,
    SERVERPROPERTY('Edition') AS edition,
    SERVERPROPERTY('ProductVersion') AS product_version,
    SERVERPROPERTY('ProductLevel') AS product_level,
    SERVERPROPERTY('EngineEdition') AS engine_edition,
    sqlserver_start_time
FROM sys.dm_os_sys_info;

-- Overall CPU and NUMA topology reported by SQL Server.
SELECT
    cpu_count AS logical_cpu_count,
    hyperthread_ratio,
    socket_count AS sockets,
    cores_per_socket,
    numa_node_count,
    scheduler_count,
    scheduler_total_count,
    max_workers_count,
    virtual_machine_type_desc
FROM sys.dm_os_sys_info;

-- Per-NUMA node scheduler and memory visibility.
-- Excludes the DAC node to keep the output focused on normal workload schedulers.
SELECT
    node_id,
    node_state_desc,
    memory_node_id,
    cpu_affinity_mask,
    online_scheduler_count,
    active_worker_count,
    avg_load_balance,
    timer_task_affinity_mask,
    permanent_task_affinity_mask,
    processor_group
FROM sys.dm_os_nodes
WHERE node_state_desc IS NOT NULL
AND node_state_desc <> 'ONLINE DAC'
ORDER BY node_id;

-- Scheduler-level detail for visible online schedulers.
SELECT
    scheduler_id,
    parent_node_id,
    status,
    is_online,
    is_idle,
    current_tasks_count,
    runnable_tasks_count,
    current_workers_count,
    active_workers_count,
    work_queue_count,
    load_factor
FROM sys.dm_os_schedulers
WHERE scheduler_id < 255
AND status = 'VISIBLE ONLINE'
ORDER BY parent_node_id, scheduler_id;

-- CPU affinity and parallelism-related configuration.
SELECT
    name,
    value,
    value_in_use,
    description
FROM sys.configurations
WHERE name IN
(
    'affinity mask',
    'affinity64 mask',
    'affinity I/O mask',
    'affinity64 I/O mask',
    'max degree of parallelism',
    'cost threshold for parallelism'
)
ORDER BY name;
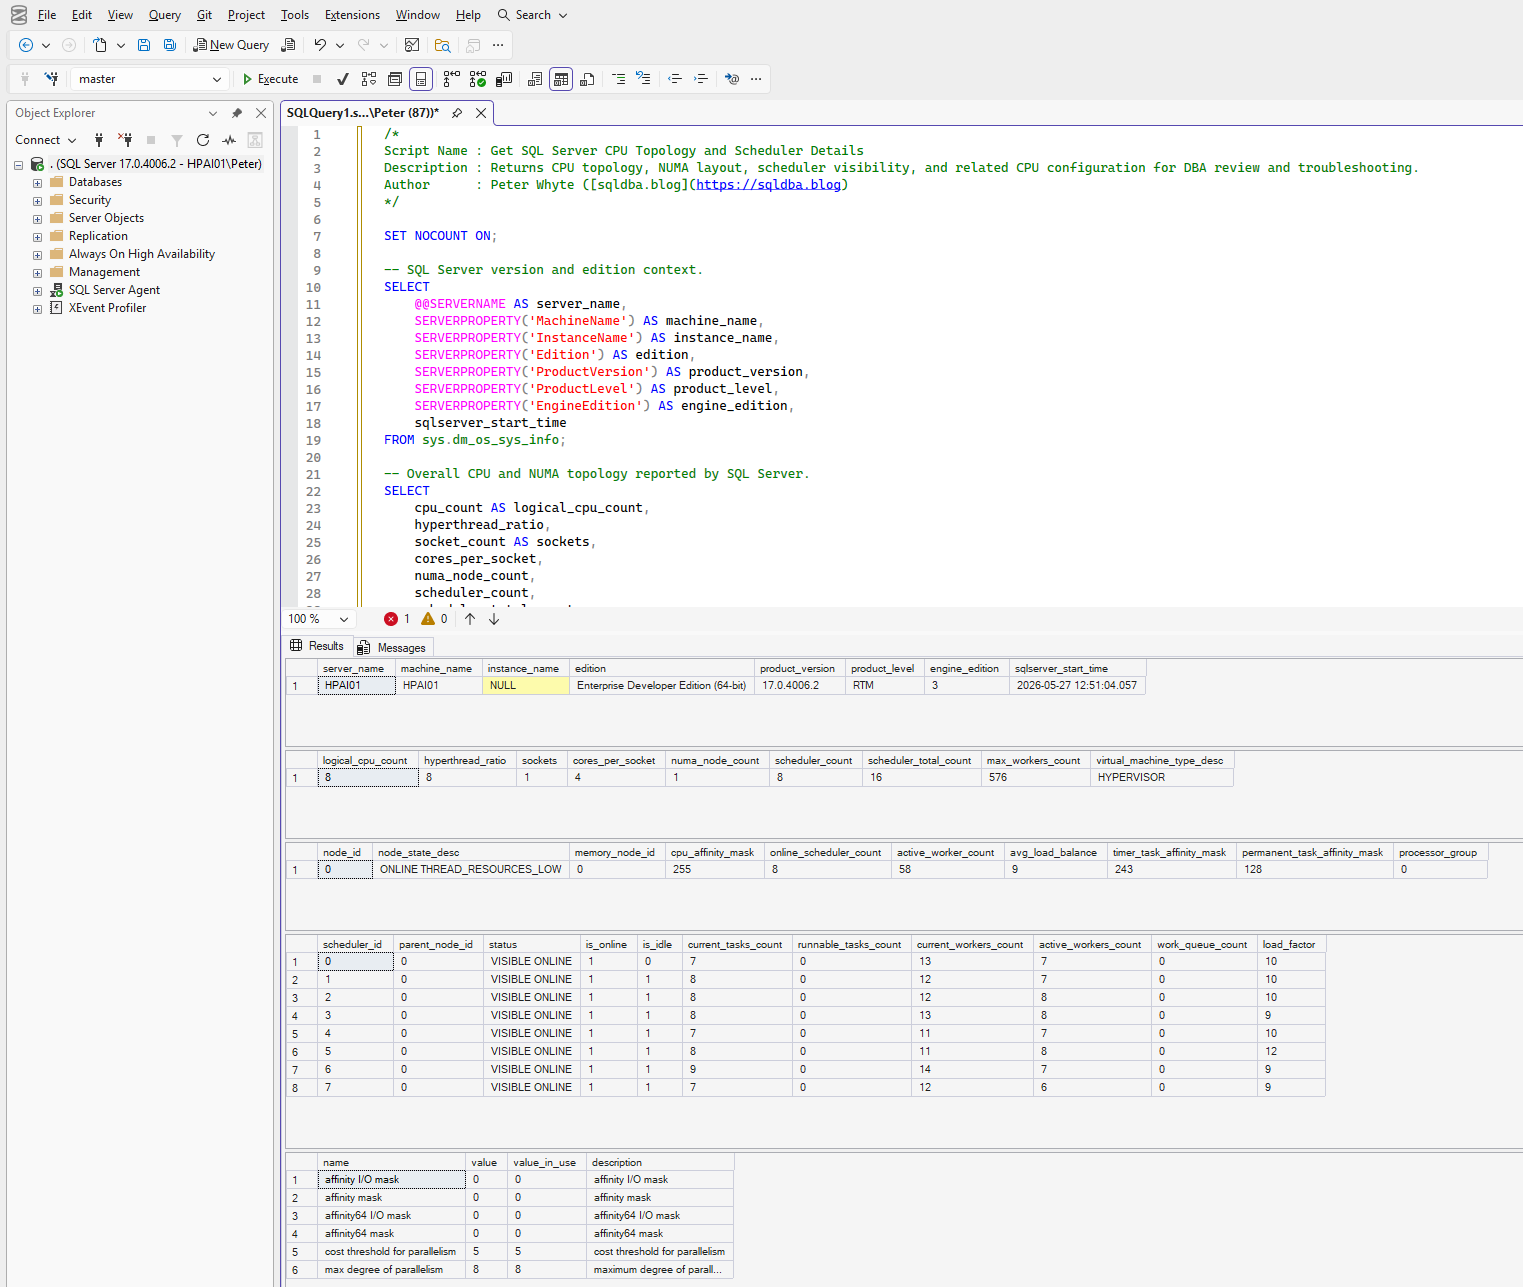
The main things I check are whether SQL Server can see the expected number of logical CPUs, whether the NUMA layout looks right, and whether the visible scheduler count lines up with the server or VM configuration.
The scheduler section is useful for a quick CPU pressure check. If runnable_tasks_count or work_queue_count is consistently above 0 across schedulers, that is worth looking into further.
I also like having the affinity and parallelism settings in the same output. If CPU affinity has been set manually, or if MAXDOP and cost threshold are still sitting at defaults, that gives you useful context before going deeper into performance troubleshooting.
For example, on a small test instance, you might see SQL Server reporting 8 logical CPUs, 1 socket, 4 cores per socket, and 1 NUMA node. On larger production servers, this output is useful for checking processor groups, NUMA layout, and scheduler distribution.
This is not a full CPU health check, but it is a useful starting point when you want to confirm what SQL Server can actually see from inside the engine.
Leave a Reply