Monitoring transaction log space usage is a fundamental DBA task. If a log file runs out of space, transactions can fail, applications can stop, and in the worst cases databases can be taken offline.
This post shows two practical ways to check log space usage in SQL Server, starting with a built-in command and then moving to a more flexible T-SQL approach that’s better suited to monitoring and automation.
Why Log Space Monitoring Matters
Transaction logs grow and shrink based on workload, recovery model, and backup strategy. If you are not keeping an eye on log usage, problems often surface at the worst possible time.
If you also need to understand where log files live on disk and how they are configured to grow, see Get Database File Names and Paths in SQL Server.
Common scenarios where log space becomes an issue include:
- Long-running or uncommitted transactions
- Missing or failing log backups
- Unexpected workload spikes
- Incorrect recovery model configuration
Knowing how much log space is used, and how fast it changes, helps you avoid all of the above.
Method 1: Using DBCC SQLPERF
SQL Server provides a built-in command that returns transaction log usage for all databases on an instance.
-- Get database transaction log usage
DBCC SQLPERF(logspace);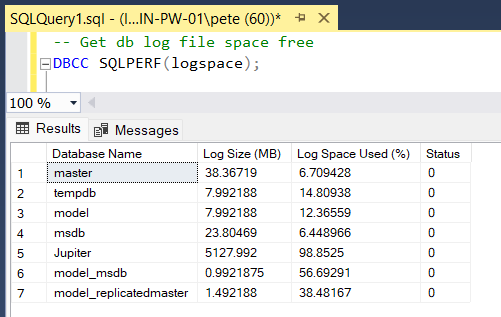
This is the fastest way to get a quick snapshot of log usage across the instance. It’s ideal for ad-hoc checks, incident response, or confirming whether a log backup is having the expected effect.
What it does not give you is historical tracking or easy formatting for dashboards.
👉 Microsoft Docs: DBCC SQLPERF (Transact-SQL)
Method 2: T-SQL Script for Log Space Usage
For ongoing monitoring or reporting, a custom query is often more useful.
This query returns log usage for the current database, with values that are easy to sort, alert on, or feed into monitoring tools.
SELECT
    DB_NAME() AS DatabaseName,
    CAST(total_log_size_in_bytes / 1024.0 / 1024 AS DECIMAL(18,2)) AS TotalLogSizeMB,
    CAST(used_log_space_in_bytes / 1024.0 / 1024 AS DECIMAL(18,2)) AS LogSpaceUsedMB,
    CAST(
        (used_log_space_in_bytes * 100.0) / total_log_size_in_bytes
        AS DECIMAL(5,2)
    ) AS LogSpaceUsedPercent,
    CAST(
        (total_log_size_in_bytes - used_log_space_in_bytes) / 1024.0 / 1024
        AS DECIMAL(18,2)
    ) AS LogSpaceFreeMB
FROM sys.dm_db_log_space_usage;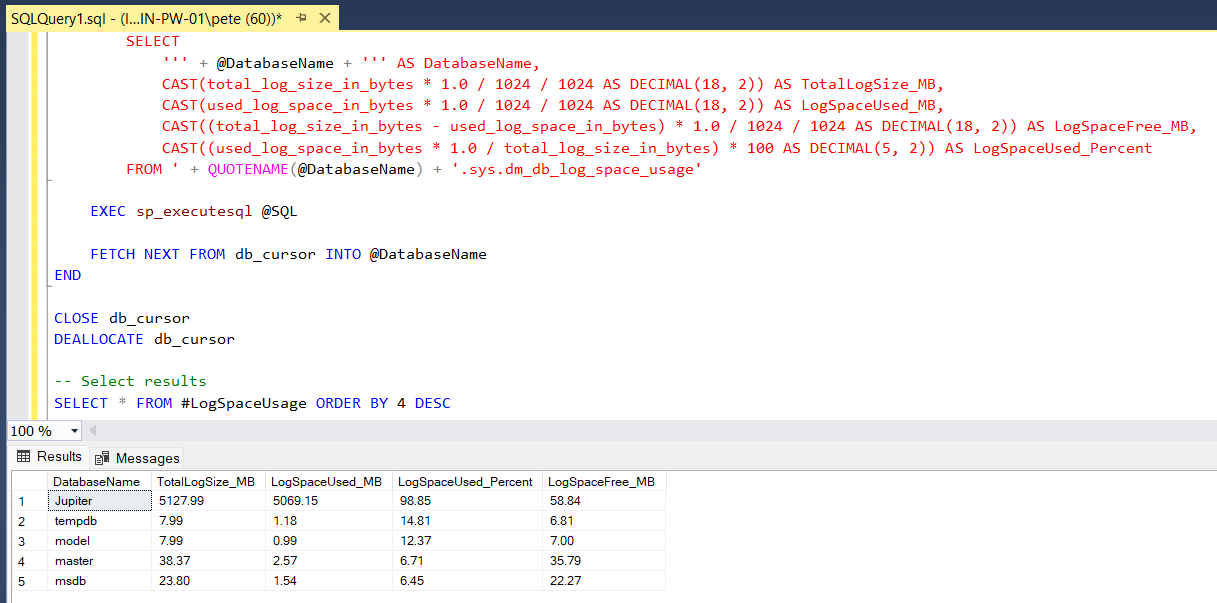
This approach is better when you want:
- Sorted results
- Size calculations you control
- Integration into monitoring jobs or dashboards
- Repeatable checks across environments
Interpreting the Results
When reviewing log usage, pay particular attention to:
- Databases consistently sitting at high percentages
- Rapid growth during specific workloads
- Logs that never seem to truncate after backups
High usage alone is not always a problem. High usage with no reduction after log backups is.
If you are investigating log pressure during maintenance or data cleanup, also see:
👉 Deleting Rows in Batches in SQL Server
👉 Applying Data Retention Safely in SQL Server
Log File Management Best Practices
A few practical rules that avoid most log-related incidents:
- Right-size log files
Avoid tiny logs that constantly autogrow. Size for expected workload. - Run regular log backups
In full recovery, missing log backups are the most common cause of log exhaustion. - Monitor, don’t guess
Alerts on log usage thresholds catch problems early. - Understand log reuse
Know why a log is not truncating before trying to “fix” it.
👉 Microsoft Docs: SQL Server transaction log architecture and management
Final Thoughts
Transaction logs are predictable when monitored and painful when ignored.
Having a quick check (DBCC SQLPERF) and a scriptable option (DMVs) covers almost every real-world scenario you’ll run into as a DBA.
This is one of those areas where a few minutes of monitoring can save hours of recovery work later.
Leave a Reply