
CXPACKET and CXCONSUMER appear whenever SQL Server runs a query in parallel. They are coordination overhead between worker threads, not waits on a resource.
CXPACKET: a producer thread waiting for a consumer to take rows, or the coordinator waiting for all workers to finish.CXCONSUMER: a consumer thread waiting for rows from a producer. Before 2016 SP2 this was counted as CXPACKET.
Is This Wait Expected?
Yes, they will appear on any server that runs parallel queries. Some level of CXPACKET/CXCONSUMER is completely normal and indicates SQL Server is using parallelism productively.
It becomes a signal worth investigating when:
- CXPACKET is your #1 wait type by a wide margin, especially on an OLTP server
- OLTP queries that should be fast (< 100ms) are running in parallel unnecessarily
- You’re seeing high
avg_wait_msfor CXPACKET (indicates threads are seriously out of sync) - Users complain about slow ad-hoc queries that aren’t returning large data sets
When To Ignore It
Analytics and reporting workloads, parallel queries are beneficial for large aggregations, sorts, and scans. CXPACKET being high on a reporting server is expected and healthy.
Nightly batch jobs, ETL, index rebuilds, statistics updates, and DBCC CHECKDB all benefit from parallelism. Ignore CXPACKET during maintenance windows.
Any server with moderate CXPACKET alongside other waits, if CXPACKET is 10 to 15% of total waits and other waits are present, it’s just background parallelism coordination. Only chase it when it’s dominant.
Root Causes
Four causes produce the same exchange waits, and three of them are settings rather than queries. Work out which is yours before changing anything, because two of these fixes are instance-wide.
The default is 5, and it has been 5 since 1998. A query is measured in optimiser cost units and anything estimated above the threshold is allowed a parallel plan; on modern hardware trivial OLTP queries clear 5 easily. Raising it to somewhere between 25 and 50 stops short queries going parallel without touching the large analytical ones that should.
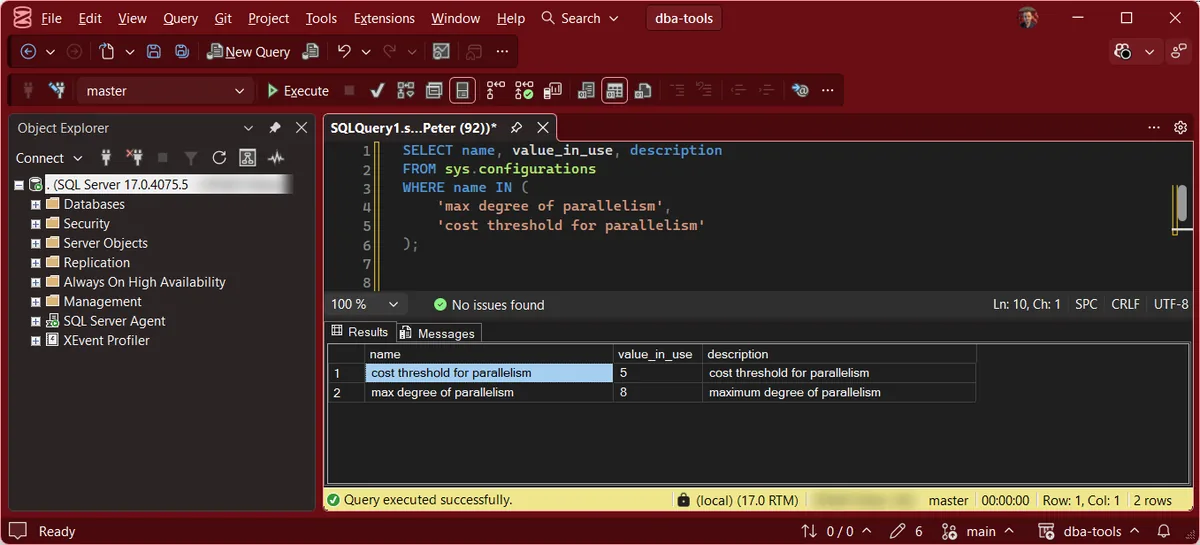
sys.configurations shows cost threshold for parallelism at 5, and queries you would call fast are showing a non-zero max_dop in sys.dm_exec_query_stats. Confirmed as the shipping default on a 2025 instance.
At 0 a query may use every logical processor, up to 64. Each parallel query then spawns threads across all of them, and more threads means more exchange coordination, which is what these waits measure. A common starting point is 4 to 8 for OLTP, or the number of logical cores in one NUMA node, whichever is smaller.
max degree of parallelism reads 0, or matches the core count, in sys.configurations. Check it against the NUMA layout rather than the total core count, because the per-node number is the one that matters.
A query that should be a narrow index seek falls back to scanning the table when the index is not there, or when the optimiser underestimates how selective the predicate is. A scan that large is costed high enough to go parallel, so the exchange waits are a symptom of the missing index rather than of parallelism itself.
The actual plan shows a parallel table or clustered index scan where you expected a seek, and the missing index DMVs suggest an index on the same predicate. Fixing the index removes the parallelism as a side effect.
A parallel plan divides rows across threads. When that split is uneven, and one thread receives most of the rows, the others finish and then sit waiting for it. The wait is real but the cause is the distribution, usually stale statistics or genuinely lopsided data.
The peak wait is far above the average: on the instance used for this page CXPACKET showed max_wait_time_ms of 349 against 4,810 ms spread over 486 waiting tasks, about ten milliseconds each. A single wait 35 times the average is threads finishing at very different times.
How To Diagnose It
Check current MAXDOP and cost threshold settings (Get MAXDOP Configuration reads both, alongside the NUMA layout they should be set against):
SELECT name, value_in_use, description
FROM sys.configurations
WHERE name IN (
    'max degree of parallelism',
    'cost threshold for parallelism'
);
Check if specific queries are driving CXPACKET:
SELECT TOP 20
    qs.total_elapsed_time / qs.execution_count  AS avg_elapsed_us,
    qs.max_dop,
    qs.execution_count,
    SUBSTRING(qt.text, (qs.statement_start_offset / 2) + 1,
        ((CASE qs.statement_end_offset WHEN -1 THEN DATALENGTH(qt.text)
          ELSE qs.statement_end_offset END - qs.statement_start_offset) / 2) + 1) AS statement_text
FROM sys.dm_exec_query_stats qs
CROSS APPLY sys.dm_exec_sql_text(qs.sql_handle) qt
WHERE qs.max_dop > 1
ORDER BY qs.total_elapsed_time DESC;
Queries with high max_dop that are supposed to be fast OLTP queries are your targets.
Spot skewed parallelism: look for queries where the actual execution plan shows very uneven row counts across parallel threads. In SSMS: run the query with “Include Actual Execution Plan”, then look at the parallel operators, hover over the arrows to see per-thread row counts.
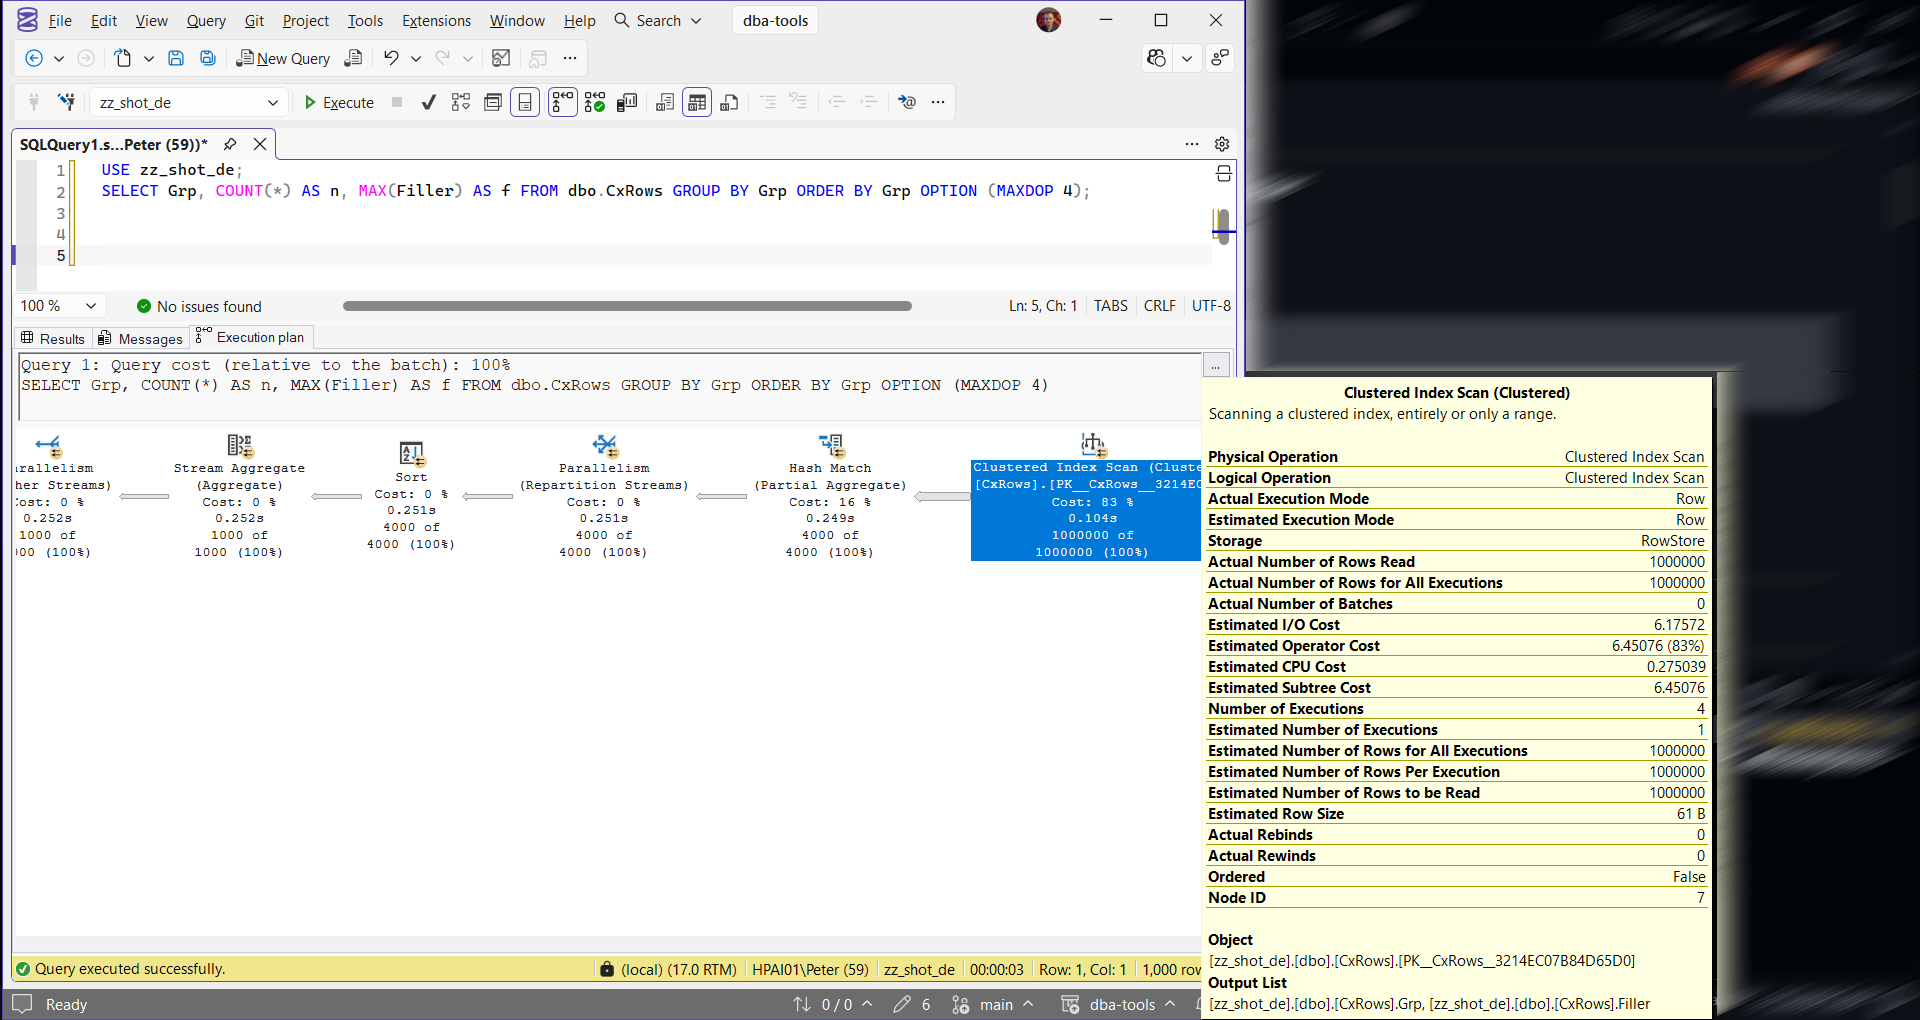
This is what a parallel plan looks like. The Parallelism operators are where the work is split across threads and gathered back, and on the scan, Number of Executions reads 4: one per thread, matching MAXDOP 4. Those hand-offs between threads are where CXPACKET and CXCONSUMER waits come from.
What To Do
In priority order. The first two are instance-wide settings, so they change every query on the server; the rest get narrower as you go down.
Step 1: Raise the Cost Threshold for Parallelism
Almost always the first fix, and the cheapest: it stops small queries going parallel at all rather than changing how the big ones behave.
EXEC sp_configure 'cost threshold for parallelism', 50;
RECONFIGURE;
Start at 25 and watch, rather than jumping to 50 and hoping. The right value depends on what your workload actually costs; MAXDOP and Cost Threshold covers how to pick it and why 5 was never a recommendation.
Step 2: Set MAXDOP to Something Deliberate
This caps how many processors any single query may use. It does not stop parallelism, it stops one query taking the whole box.
EXEC sp_configure 'max degree of parallelism', 4;
RECONFIGURE;
For mixed OLTP and reporting, 4 to 8 is a common starting point. On a NUMA system use the number of logical cores in one node, because a query spanning nodes pays for memory access as well as coordination.
Step 3: Fix the Query, Not the Instance
The two settings above are instance-wide, so they change every query on the server. When one query is the problem, hint that query instead while you work out why it goes parallel.
-- illustrative shape, not runnable
SELECT ... FROM ... WHERE ... OPTION (MAXDOP 1);
Treat the hint as a splint, not a fix. If the plan went parallel because of a scan, the real answer is the index, and Get Missing Indexes will usually name it.
Step 4: Address Skewed Parallelism
If the threads are finishing at very different times, the split is uneven and no setting will fix it. Update the statistics on the tables involved, add the index that avoids the large scan, and look at whether the data itself is lopsided enough to need a filtered index.
Step 5: Separate the Workloads With Resource Governor
Enterprise edition only, and last on the list because it manages the problem rather than removing it. A different MAX_DOP per workload group lets reporting queries use more processors while OLTP traffic is held down, which is the right shape when both genuinely run on one instance.
Related Scripts
- Get-WaitStatistics, the instance-wide wait overview script
- Get-MissingIndexes, missing indexes often cause parallel scans
- Get-MaxdopConfiguration, both settings against the CPU layout, with the recommended MAXDOP worked out
- MAXDOP and Cost Threshold: What To Set, and Why 5 Is Not a Recommendation, the settings post behind both fixes below
- SQL Server High CPU, the walkthrough that decides working versus waiting before any setting is touched
Leave a Reply