This script returns currently executing queries ordered by elapsed time. It helps identify long-running requests that may be causing blocking, resource pressure, or user-facing delays.
This is typically used during live performance incidents when users report slowness or when the instance appears busy.
The Script
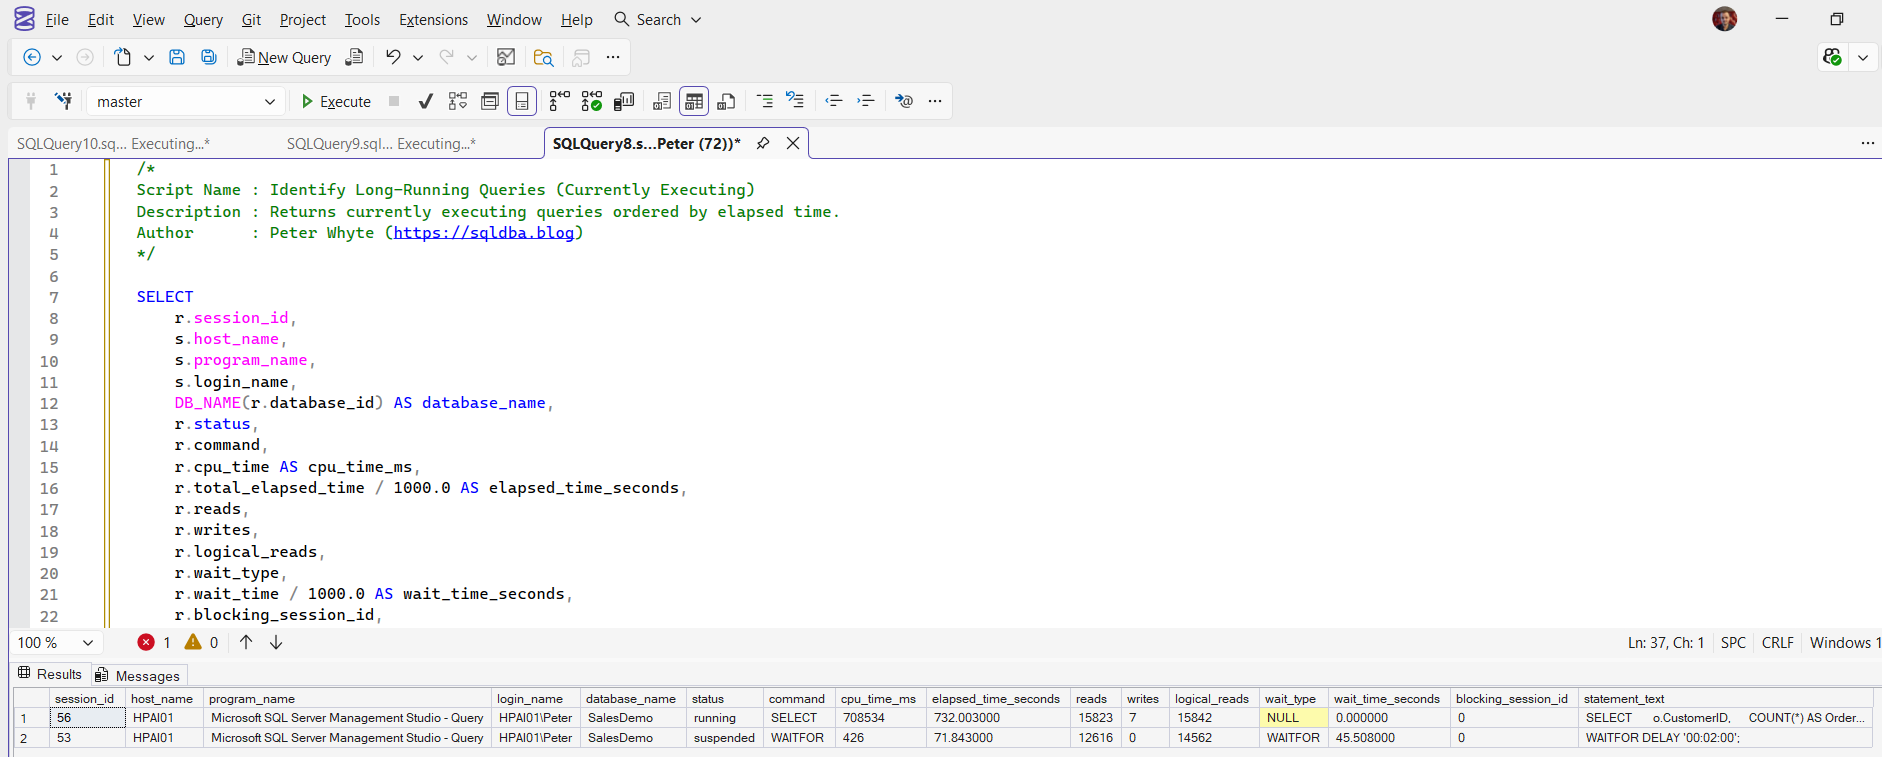
Example Output
The result set shows currently executing sessions ordered by elapsed time, including CPU usage, reads, writes, waits, blocking relationships, and the running statement text.
This provides an immediate view of what is actively consuming time on the instance.
Notes
- Only shows currently executing requests
- Does not include completed queries
- High elapsed time combined with
blocking_session_idmay indicate blocking chains - Useful alongside wait statistics and CPU analysis scripts
Leave a Reply