Database file growth events are easy to ignore until they become a problem.
When a data or log file autogrows, SQL Server must extend the physical file on disk before continuing. During this operation, activity against that file can stall. If this happens frequently, it can introduce latency, increase I/O pressure, and in some cases trigger disk space incidents. For DBAs, understanding when files grow and which databases are responsible is essential when troubleshooting performance or capacity issues.
This post shows a simple, read-only SQL Server script to view recent database and log file growth events using the built-in default trace.
If you need to track growth events over time or analyse longer-term patterns, see Track Database Growth Events Over Time in SQL Server.
When I Use This Script
This is typically one of the first checks I run when:
- A disk space alert fires unexpectedly
- TempDB grows rapidly
- Transaction log backups appear delayed
- An application reports unexplained latency
- Storage consumption increases without a clear workload change
It provides immediate historical context during incident response calls.
Why Growth Events Matter During Investigations
Auto-growth is not inherently bad, but it should be predictable and infrequent.
Growth events often surface during investigations into:
- Unexpected disk space consumption
- Performance slowdowns under load
- Excessive file fragmentation
- Poorly sized data or log files
- Missing or incorrect growth settings
If you’re seeing frequent growth events, it usually points to reactive sizing rather than planned capacity management.
If you want a current snapshot of database file sizes and available free space, see Get Database Sizes and Free Space in SQL Server.
How This Script Works
SQL Server’s default trace captures a range of system events, including file growth operations. By querying that trace, we can retrieve:
- When a file grew
- Which database was affected
- Whether it was a data or log file
- How much the file grew
- How long the growth operation took
This makes the script particularly useful during post-incident analysis or when reviewing historical behaviour after a disk alert.
Important note on duration: Data file growth can benefit from Instant File Initialization (IFI), which significantly reduces growth time. Log files do not use IFI and must always be zero-initialised, which is why log growth events often show longer durations.
Because this relies on the default trace, it is best suited to short-term investigations rather than ongoing monitoring.
Script: Show Database and Log File Growth Events
This script is intended for ad-hoc use during troubleshooting or post-incident review.
Run the following query in SQL Server Management Studio.
SET NOCOUNT ON;

DECLARE @filename NVARCHAR(1000);
DECLARE @bc INT;
DECLARE @ec INT;
DECLARE @bfn NVARCHAR(1000);
DECLARE @efn NVARCHAR(10);

-- Get current default trace file
SELECT @filename = CAST(value AS NVARCHAR(1000))
FROM ::fn_trace_getinfo(DEFAULT)
WHERE traceid = 1
  AND property = 2;

-- Derive base filename (handle rollover)
SET @filename = REVERSE(@filename);
SET @bc = CHARINDEX('.', @filename);
SET @ec = CHARINDEX('_', @filename) + 1;
SET @efn = REVERSE(SUBSTRING(@filename, 1, @bc));
SET @bfn = REVERSE(SUBSTRING(@filename, @ec, LEN(@filename)));
SET @filename = @bfn + @efn;

-- Read growth events from default trace
SELECT
    ftg.StartTime,
    te.name AS EventName,
    DB_NAME(ftg.databaseid) AS DatabaseName,
    ftg.Filename,
    CAST((ftg.IntegerData * 8) / 1024.0 AS DECIMAL(10,2)) AS GrowthMB,
    ftg.duration / 1000 AS DurationMS
FROM ::fn_trace_gettable(@filename, DEFAULT) AS ftg
JOIN sys.trace_events AS te
    ON ftg.EventClass = te.trace_event_id
WHERE ftg.EventClass IN
(
    92, -- Data File Auto-grow
    93  -- Log File Auto-grow
)
ORDER BY ftg.StartTime DESC;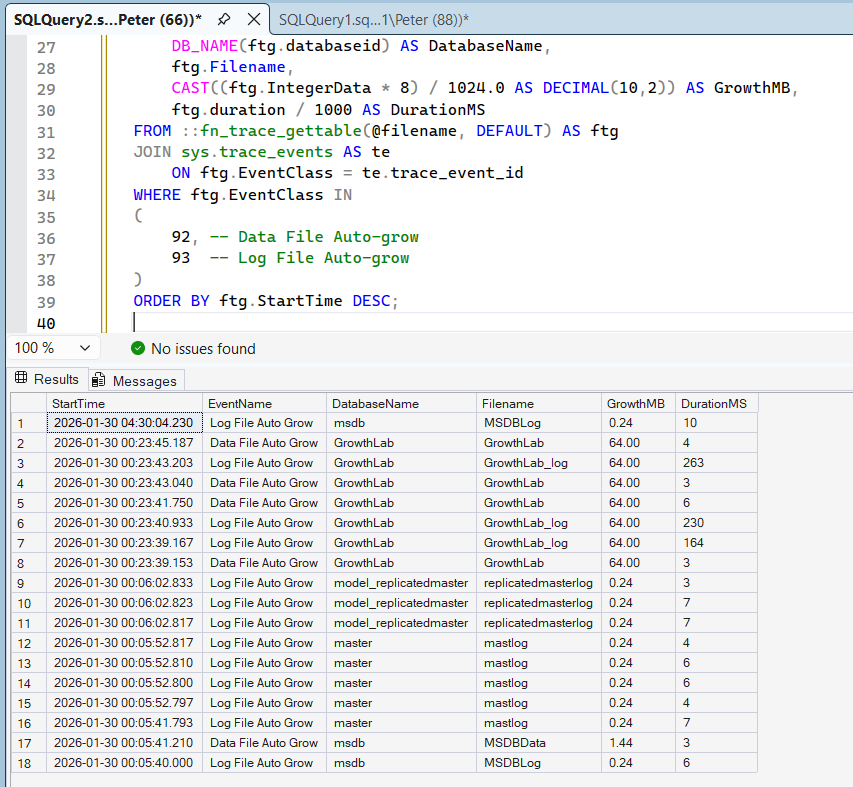
This returns the most recent file growth events captured by the default trace, ordered by time.
Interpreting the Results
When reviewing the output, pay close attention to:
- Databases appearing repeatedly
- Large growth increments
- Growth events occurring during peak workload periods
- Long growth durations
Healthy Pattern
- Infrequent growth
- Large fixed growth increments
- Growth occurring during predictable workload expansion
Unhealthy Pattern
- Frequent small growth increments
- Repeated log file growth
- Growth during peak transactional workload
- Long durations under storage pressure
Frequent small growth events are often a sign that files are undersized or configured with poor growth settings.
Important Limitations
A few things to keep in mind:
- The default trace only retains recent history
- Data is cleared after SQL Server restarts
- This is not a replacement for long-term monitoring
Additional considerations:
- The default trace has limited rollover capacity and can miss events under sustained load.
- It is not available in all managed cloud scenarios.
- Microsoft’s long-term direction favours Extended Events over trace-based monitoring.
For repeat analysis or capacity planning, growth events should be logged persistently rather than queried directly from the trace, see: Track Database Growth Events Over Time in SQL Server
Related Posts
If you’re reviewing growth events, these posts naturally go hand-in-hand:
- Get Database File Names and Paths in SQL Server
Useful for understanding where growing files live on disk and how they are configured. - How to Check Transaction Log Space Usage in SQL Server
Helpful when log file growth appears frequently or unexpectedly.
Microsoft Documentation
If you want to understand the underlying mechanics behind file growth and storage behaviour, check out the following documentation links below:
Microsoft Docs: SQL Server Transaction Log Architecture & Management
Microsoft Docs: Database Instant File Initialization
Final Thoughts
Database growth events are one of those signals that quietly reveal how well an environment is planned.
This script is ideal for quick insight during investigations, but repeated growth should always prompt a deeper look at sizing, growth settings, and workload patterns.
Used correctly, this script helps distinguish between:
- A one-off expansion event
- An environment that is consistently under-provisioned
Used alongside persistent tracking, it helps separate one-off incidents from ongoing capacity problems.
Leave a Reply