
Every committed transaction in SQL Server must wait for its log records to be written to disk before the commit is acknowledged. WRITELOG is the wait for that write to complete. It is present on every transactional system, the question is whether it is high enough to be a real bottleneck.
SQL Server writes log records in batches (log blocks), flushing them when a commit occurs or the log buffer fills. WRITELOG measures the time from “flush requested” to “flush completed.” Anything that slows the log disk, or increases flush frequency, raises this wait.
Is This Wait Expected?
Yes, some WRITELOG is inherent in any transactional workload. The question is whether it is in proportion to the work being done.
Signs it is a real problem:
WRITELOGis consistently the #1 or #2 wait typeavg_wait_msis above 3–5ms (on modern storage, log writes should be sub-millisecond)- You are seeing slow insert/update performance and this is the dominant wait
max_wait_time_msis very high (occasional I/O stalls, the worst kind)
Treat the numbers above as starting points, not limits. Baseline this wait on your own hardware during a normal week; the thresholds worth acting on are the ones your workload proves.
When To Ignore It
High transaction volume workloads, if you are doing tens of thousands of commits per second, some WRITELOG is unavoidable. Focus on avg_wait_ms, not just the total.
Bulk load operations, a large bulk insert with minimal logging will spike WRITELOG briefly then settle. One-off events are not a problem.
High Availability groups (synchronous commit), the log hardening wait in synchronous AG (HADR_SYNC_COMMIT) interacts with WRITELOG. If the secondary is slow, you will see WRITELOG elevated on the primary. This is really a HADR_SYNC_COMMIT problem, check that wait type too.
Root Causes
Slow log disk, the most common cause. Log writes are sequential and frequent. The log file should be on the fastest storage available. Spinning disk, shared SANs, or log files sharing a volume with data files all degrade this. avg_write_ms on the log file in sys.dm_io_virtual_file_stats should be below 1–2ms on SSD.
Log file shared with data files, a very common configuration mistake, especially on test/dev servers promoted to production. Data reads are random; log writes are sequential. Mixing them on the same disk creates I/O contention.
Chatty commit patterns, applications that commit after every row insert, or that use a tight BEGIN TRAN / COMMIT loop, generate far more log flushes than necessary. Each commit is a separate log write request. Batching 1000 row inserts into one transaction reduces log write frequency by 1000x.
Very high transaction rate, some WRITELOG at high TPS is unavoidable. At very high rates, the log disk throughput can simply become a ceiling.
AG synchronous secondary lag, with synchronous commit AGs, the primary must wait for the secondary to harden the log before committing. A slow secondary network or slow secondary disk shows up as WRITELOG on the primary, combined with elevated HADR_SYNC_COMMIT.
How To Diagnose It
Check log file I/O latency:
SELECT
    DB_NAME(vfs.database_id)        AS database_name,
    mf.physical_name,
    vfs.io_stall_write_ms              AS write_stall_ms,
    vfs.num_of_writes,
    CASE WHEN vfs.num_of_writes > 0
         THEN CAST(vfs.io_stall_write_ms * 1.0 / vfs.num_of_writes AS decimal(10,1))
         ELSE 0
    END AS avg_write_ms,
    vfs.io_stall                    AS total_io_stall_ms
FROM sys.dm_io_virtual_file_stats(NULL, NULL) vfs
JOIN sys.master_files mf
    ON mf.database_id = vfs.database_id
    AND mf.file_id    = vfs.file_id
WHERE mf.type_desc = 'LOG'
ORDER BY vfs.io_stall_write_ms DESC;
avg_write_ms above 2–5ms consistently indicates the log disk is the bottleneck. Above 20ms means the disk is genuinely undersized or overloaded.
Check if sessions are currently in WRITELOG wait:
SELECT
    r.session_id,
    r.wait_type,
    r.wait_time / 1000.0            AS wait_sec,
    r.blocking_session_id,
    DB_NAME(r.database_id)          AS database_name,
    SUBSTRING(t.text, (r.statement_start_offset / 2) + 1,
        ((CASE r.statement_end_offset WHEN -1 THEN DATALENGTH(t.text)
          ELSE r.statement_end_offset END - r.statement_start_offset) / 2) + 1) AS current_statement
FROM sys.dm_exec_requests r
CROSS APPLY sys.dm_exec_sql_text(r.sql_handle) t
WHERE r.wait_type = 'WRITELOG'
ORDER BY r.wait_time DESC;
Check if it is an AG issue:
SELECT
    replica_id,
    log_send_queue_size,
    log_send_rate,
    redo_queue_size,
    synchronization_state_desc
FROM sys.dm_hadr_database_replica_states
WHERE is_local = 0;
A high log_send_queue_size indicates the secondary cannot keep up.
What To Do
Slow log disk:
- Move the log file to a dedicated fast disk (SSD or NVMe ideally)
- Separate log files from data files if they share a volume
- Check storage queue depth in Performance Monitor (
PhysicalDisk\Current Disk Queue Lengthon the log volume)
Chatty commit patterns:
- Identify the application or job doing frequent small commits
- Refactor row-by-row inserts into set-based operations
- Or batch commits, instead of committing after every row, commit every 500 or 1000 rows
- Review SSIS or ETL packages for
Row by Rowcommit modes
AG secondary lag:
- Check network latency between primary and secondary
- Check secondary disk write performance
- For geographically distant secondaries, evaluate whether asynchronous commit is more appropriate
As a temporary measure only:
- For write-heavy applications under strict SLA, delayed durability (
DELAYED_DURABILITY = FORCED) can reduceWRITELOGby batching log flushes. This trades write performance for a small data loss window, appropriate only for specific use cases (audit logs, telemetry) not for transactional data.
When tempdb Is The Source
WRITELOG does not show which database’s log is slow, it is a single aggregate wait across all databases including tempdb. If you diagnose WRITELOG and your production log files look healthy, tempdb may be the real source.
Break tempdb’s own files out, log file first:
-- tempdb is always database_id 2, so scope the function call to it and keep every file
SELECT
    mf.name                     AS file_name,
    mf.type_desc,
    mf.physical_name,
    vfs.io_stall_write_ms       AS write_stall_ms,
    vfs.num_of_writes,
    CASE WHEN vfs.num_of_writes > 0
         THEN CAST(vfs.io_stall_write_ms * 1.0 / vfs.num_of_writes AS decimal(10,1))
         ELSE 0
    END AS avg_write_ms
FROM sys.dm_io_virtual_file_stats(2, NULL) vfs
JOIN sys.master_files mf
    ON mf.database_id = vfs.database_id
    AND mf.file_id    = vfs.file_id
ORDER BY CASE WHEN mf.type_desc = 'LOG' THEN 0 ELSE 1 END, vfs.io_stall_write_ms DESC;
The templog row is the one that drives WRITELOG. If its avg_write_ms is high while the production log files in the first query on this page look healthy, tempdb log pressure is driving the wait. The ROWS rows are context: heavy tempdb data latency does not cause WRITELOG itself, but it travels with the same tempdb pressure and is usually the thing you end up fixing.
What generates tempdb log writes:
- Temporary tables, inserts, updates, drops are fully logged in tempdb
- Sort and hash spills, when queries spill to worktables in tempdb
- Row versioning (RCSI/Snapshot Isolation), every modified row generates a version entry in tempdb
- Table-Valued Parameters, materialised in tempdb on each call
- Online index rebuilds, version store written to tempdb for the duration
Find the top tempdb consumers:
SELECT TOP 20
    s.session_id,
    s.login_name,
    s.program_name,
    su.user_objects_alloc_page_count                                                    AS user_obj_pages,
    su.internal_objects_alloc_page_count                                                AS internal_obj_pages,
    (su.user_objects_alloc_page_count + su.internal_objects_alloc_page_count) * 8 / 1024 AS total_tempdb_mb
FROM sys.dm_db_session_space_usage su
JOIN sys.dm_exec_sessions s ON s.session_id = su.session_id
WHERE su.database_id = 2
  AND (su.user_objects_alloc_page_count + su.internal_objects_alloc_page_count) > 128
ORDER BY total_tempdb_mb DESC;
internal_objects_alloc_page_count is the spill indicator, sessions with high internal page counts are writing sort/hash worktables to disk.
Check version store size if RCSI is in use:
SELECT
    SUM(version_store_reserved_page_count) * 8 / 1024  AS version_store_mb
FROM sys.dm_db_file_space_usage
WHERE database_id = 2;
Fixes for tempdb-driven WRITELOG:
- Move tempdb’s log file to dedicated fast storage (SSD/NVMe, separate volume from tempdb data files)
- Fix spilling queries,
.\run.ps1 Get-MissingIndexesand update statistics on the offending tables - Replace row-by-row temp table inserts with set-based
INSERT INTO #temp SELECT ... - For RCSI version store growth, identify and shorten long-running read transactions: query
sys.dm_tran_active_snapshot_database_transactionsfor active snapshot transactions by elapsed time
Related Scripts
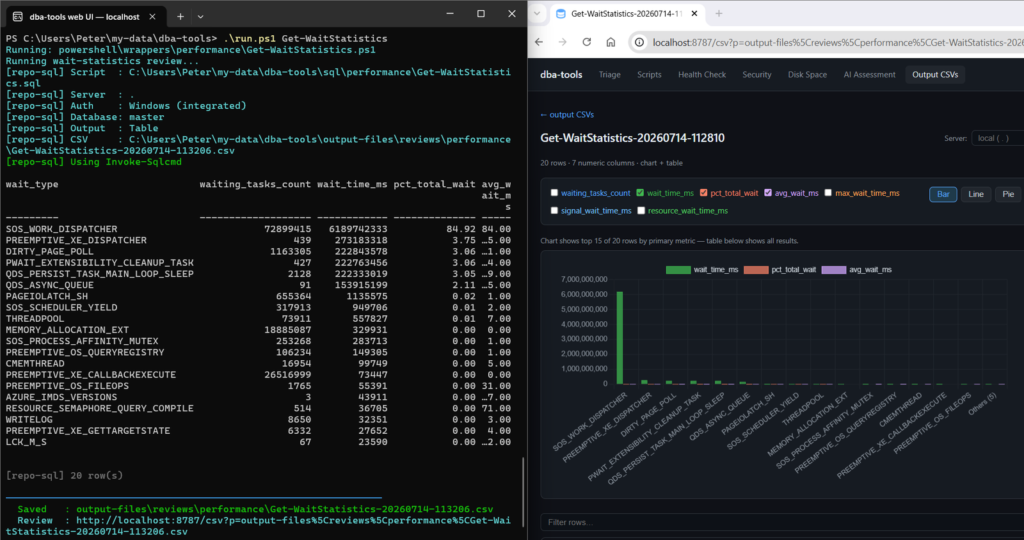
- Get-WaitStatistics, the overview script
- Get-VlfCount, VLF count affects log flush behavior; high VLF counts can compound WRITELOG waits
- Get-TransactionLogSizeAndUsage, log file sizing and usage
- Get-TempdbHotspots, allocation page contention in tempdb
- Get-MissingIndexes, fix the root cause of most spills
Leave a Reply