
Before SQL Server runs a query that sorts or hashes large data sets, it requests a memory reservation, called a memory grant, from the resource semaphore. The semaphore controls how much of the total server memory can be allocated for query workspace at once. If the request cannot be granted immediately (not enough free workspace memory), the query waits here.
RESOURCE_SEMAPHORE is one of the more consequential wait types. It does not mean a query is running slowly, it means queries cannot start running at all. They are parked in a queue waiting for other queries to finish and release their grants, and a query that waits past the grant timeout fails with error 8645.
Is This Wait Expected?
No, not meaningfully. Some very brief waits during memory pressure spikes are possible, but RESOURCE_SEMAPHORE appearing consistently in your top waits is always a signal worth investigating.
Unlike CXPACKET or ASYNC_NETWORK_IO which are often acceptable, RESOURCE_SEMAPHORE almost always points to something actionable, usually a missing index causing unnecessarily large sort or hash operations, or inaccurate statistics causing SQL Server to misestimate how much memory a query needs.
Root Causes
Five causes, and the first three are the query’s fault while the last two are the instance’s. Work out which before you change a setting, because raising max server memory will not fix a missing index and adding an index will not fix a pool that is too small.
A query with no covering index cannot seek to the rows it needs, so it scans a large table and then sorts or hashes the result. That sort is what needs the grant. With the right index the same query is a seek, there is no sort, and there is no memory grant at all.
The actual plan carries a Sort or a Hash Match with a large grant, and the missing index DMVs suggest an index on the same predicate. The tell that confirms it is the grant going to nothing after the index exists, not the plan looking tidier.
When statistics are out of date the optimiser can think a query will process far more rows than it will, ask for a grant sized to that guess, and hold a disproportionate share of the workspace while it runs. The query itself may be perfectly fast.
granted_memory_kb is far above max_used_memory_kb for the same query in sys.dm_exec_query_memory_grants. A query that asked for hundreds of megabytes and used a few is over-granted, not slow.
The same cause, the other direction. Too small a grant lets the query start and then run out of workspace, so it spills to tempdb. Spilling queries often come back asking for more next time, which is how one bad estimate turns into contention.
total_spills above 0 in sys.dm_exec_query_stats, and spill warnings on the actual plan. Look at IO_COMPLETION next to this wait; if both are up, the spilling is doing real damage rather than just being untidy.
Every query can be efficient and the pool can still run dry, because concurrency multiplies the grants. This is a scheduling problem wearing a query problem’s clothes, and indexing will not touch it.
waiter_count above 0 in sys.dm_exec_query_resource_semaphores while grantee_count is healthy and no single grant is large. A climbing forced_grant_count says queries are waiting long enough to be let through on the minimum.
The workspace pool is a share of max server memory, so capping that caps the pool. This is the one cause on the list where the queries and the statistics are all fine and the instance is simply not allowed enough memory to run them.
target_memory_kb is a long way below max_target_memory_kb in the semaphore view, and max server memory is small next to physical RAM. Measured on the instance used for this page: 8,640 KB against 277,800 KB, with max server memory at 2,048 MB of 7,968 MB.
How To Diagnose It
See what is currently waiting and what has been granted:
SELECT
    session_id,
    request_time,
    grant_time,
    requested_memory_kb,
    granted_memory_kb,
    used_memory_kb,
    max_used_memory_kb,
    queue_id,
    wait_order,
    is_next_candidate,
    wait_time_ms,
    plan_handle
FROM sys.dm_exec_query_memory_grants
ORDER BY
    CASE WHEN queue_id IS NOT NULL THEN 0 ELSE 1 END,  -- pending first
    wait_time_ms DESC;
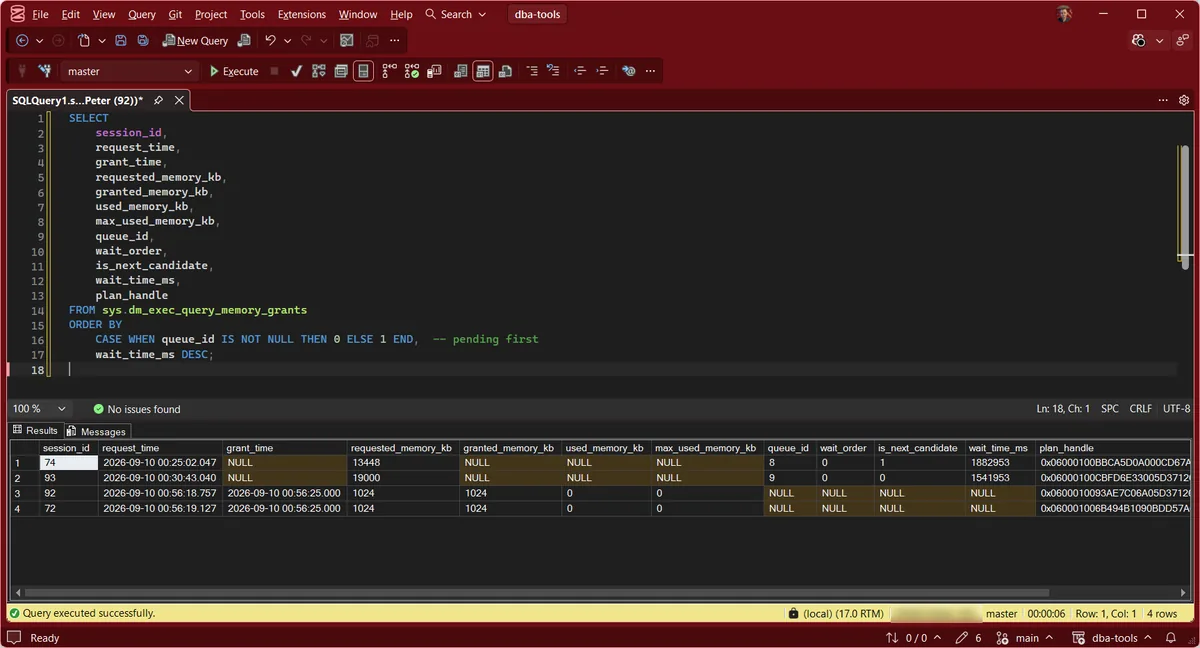
Sessions with a non-null queue_id are waiting. wait_order shows their position in the queue. requested_memory_kb shows how much they need to start.
The capture above is worth reading against the pool figures below it. Two sessions have been queued for roughly half an hour, and they are asking for 13,448 KB and 19,000 KB. On that instance the whole workspace pool is 8,640 KB, so neither request can ever be satisfied: they are not waiting behind a greedy query, they are waiting for a pool that is smaller than what they asked for. The two granted rows underneath got 1,024 KB each and used none of it. That is what cause five looks like from the query side.
Find queries that historically consume large memory grants:
SELECT TOP 20
    qs.total_grant_kb / qs.execution_count           AS avg_grant_kb,
    qs.max_grant_kb,
    qs.total_spills / qs.execution_count             AS avg_spills,
    qs.execution_count,
    SUBSTRING(qt.text, (qs.statement_start_offset / 2) + 1,
        ((CASE qs.statement_end_offset WHEN -1 THEN DATALENGTH(qt.text)
          ELSE qs.statement_end_offset END - qs.statement_start_offset) / 2) + 1) AS statement_text
FROM sys.dm_exec_query_stats qs
CROSS APPLY sys.dm_exec_sql_text(qs.sql_handle) qt
WHERE qs.total_grant_kb > 0
ORDER BY qs.total_grant_kb DESC;
Check the pool itself, not just the queries in it:
SELECT
    pool_id,
    target_memory_kb,
    max_target_memory_kb,
    available_memory_kb,
    granted_memory_kb,
    grantee_count,
    waiter_count,
    timeout_error_count,
    forced_grant_count
FROM sys.dm_exec_query_resource_semaphores;
This is the semaphore the wait is named after, and it answers a question the per-query views cannot: is the pool big enough at all? target_memory_kb is what the workspace pool is currently allowed, max_target_memory_kb what it could grow to. On the instance used for this page the two are far apart, 8,640 KB against 277,800 KB, because max server memory is capped at 2,048 MB on a box with 7,968 MB of RAM. A waiter_count above 0 means queries are queuing right now; a climbing forced_grant_count means some waited so long they were let through on the minimum grant, which is the engine telling you the pool is too small for the workload rather than the queries being wrong.
High avg_grant_kb with avg_spills > 0 means SQL Server’s estimates are consistently wrong, under-grants leading to spills. Get Memory Grant Spills in the Query Performance Deep-Dive runs this as a repo script and adds granted against used as a percentage, per query.
What To Do
In priority order, and it matches the causes above: fix the query first, the instance second, and reach for a hint or Resource Governor only when you cannot fix either yet.
Step 1: Add the Missing Index
This is the fix most of the time, and it is the only one that removes the grant rather than managing it. A query scanning 5 million rows to sort a result becomes a seek returning 200 rows with no sort at all, and the grant goes from hundreds of megabytes to nothing.
Get Missing Indexes will usually name the index the optimiser already wanted.
Step 2: Update the Statistics
Bad cardinality estimates cause both failure modes above: over-grants that hog the workspace, and under-grants that spill. Update the statistics on the tables the offending queries touch.
UPDATE STATISTICS [schema].[table_name] WITH FULLSCAN;
For a table that changes fast enough to go stale between updates, the dynamic auto-update threshold from compatibility level 130 onward is the better answer than a manual schedule.
Step 3: Give the Instance Enough Memory
Only after the first two, and only if the semaphore view says the pool is genuinely small. The workspace pool is a share of max server memory, so this raises the ceiling for every query at once.
EXEC sp_configure 'max server memory (MB)', 32768;  -- example: 32 GB
RECONFIGURE;
Leave the operating system room to work. Above roughly 80 to 90% of physical RAM you are trading one kind of memory pressure for another.
Step 4: Cap One Query, Not the Instance
When a single known-bad query is monopolising the workspace, hint that query rather than changing a server setting for everyone.
-- illustrative shape, not runnable
-- cap a query's grant so it cannot monopolise the workspace
SELECT ... FROM ... WHERE ...
OPTION (MAX_GRANT_PERCENT = 10);

-- or force a floor under one that keeps being under-granted and spilling
OPTION (MIN_GRANT_PERCENT = 5);
A hint is a splint. It holds the page together while you fix the index or the statistics underneath, and it should come out afterwards.
Step 5: Separate the Workloads With Resource Governor
Enterprise edition, and last because it partitions the problem rather than removing it. Capping a reporting pool stops one class of query starving another when both genuinely have to share an instance.
ALTER RESOURCE POOL [reporting_pool] WITH (MAX_MEMORY_PERCENT = 30);
Related Scripts
- Get-WaitStatistics, the overview script
- Get-MissingIndexes, the first place to look after finding this wait
- Get-StatisticsHealth, find stale statistics contributing to bad estimates
- Get-MemoryConfigurationAndUsage, max server memory against the RAM on the box
- Troubleshoot RESOURCE_SEMAPHORE Waits, the full diagnostic workflow, including a real host-memory incident
Leave a Reply