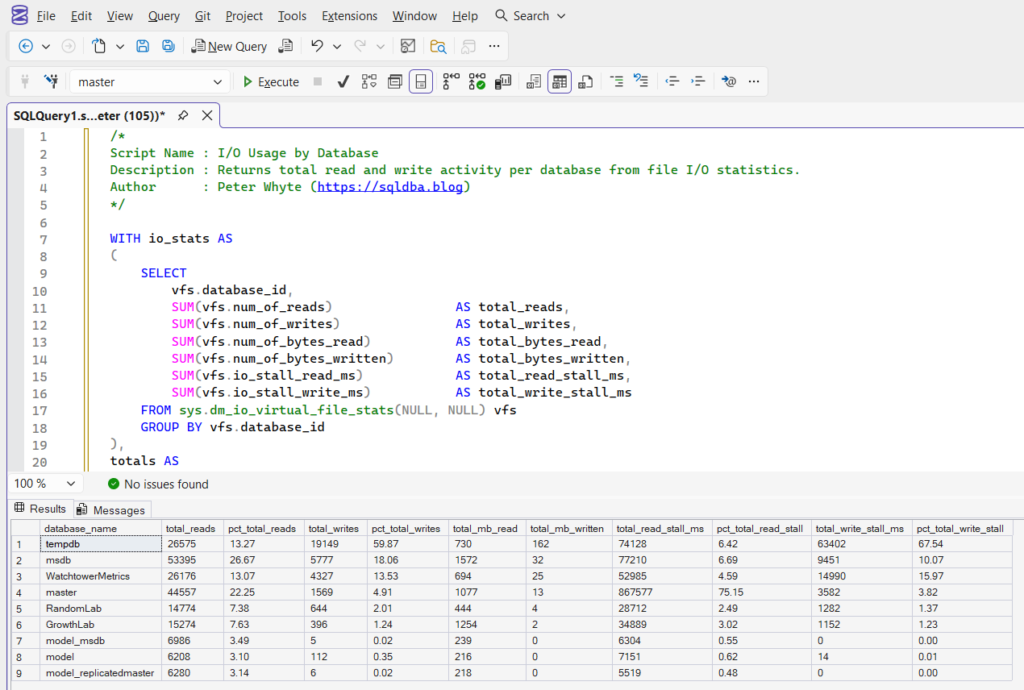
This script returns total read and write activity per database based on file-level I/O statistics. It helps identify which databases are generating the most disk activity on the instance.
This is commonly used during performance troubleshooting, storage pressure investigations, and workload analysis.
The Script
Example Output
The result set shows one row per database, including total reads, writes, megabytes read and written, and cumulative I/O stall time.
This makes it easy to identify databases generating heavy disk activity and correlate that activity with performance pressure.

Notes
- Values are cumulative since the last SQL Server restart
- High write activity often correlates with heavy transaction log usage
- High stall times may indicate storage latency
- Useful before drilling into file-level latency analysis
Leave a Reply